
|
Figure 4
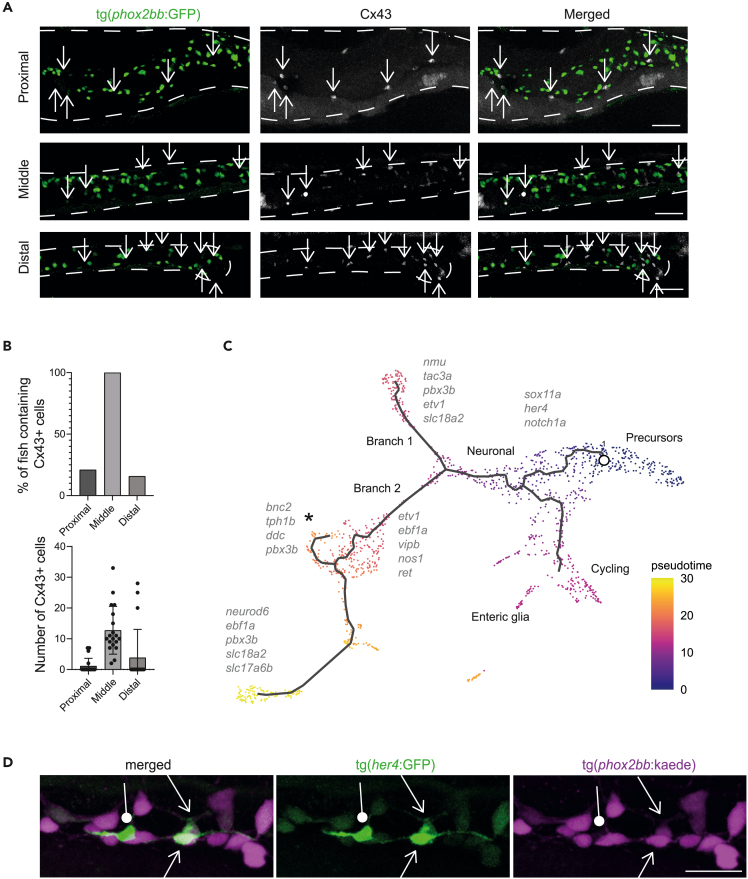
Pseudotime analysis shows differentiation trajectories from right to left of the UMAP
(A) Immunohistochemistry staining of Cx43 in the tg(
(B) Upper graph shows the percentage of larvae that contained Cx43 cells in their proximal, middle and distal intestine. The lower graph shows the number of Cx43 cells per larvae in the proximal, middle and distal intestine (n = 19, error bars show standard deviation).
(C) Pseudotime color-coded featureplot showing a bifurcation toward neuronal differentiation (sensory IPAN: branch1 and inhibitory motor neurons: branch2 containing a secondary branch toward serotonergic neurons marked with an asterix).
(D) Maximum projections of live-imaging 5 dpf tg(8.3