
|
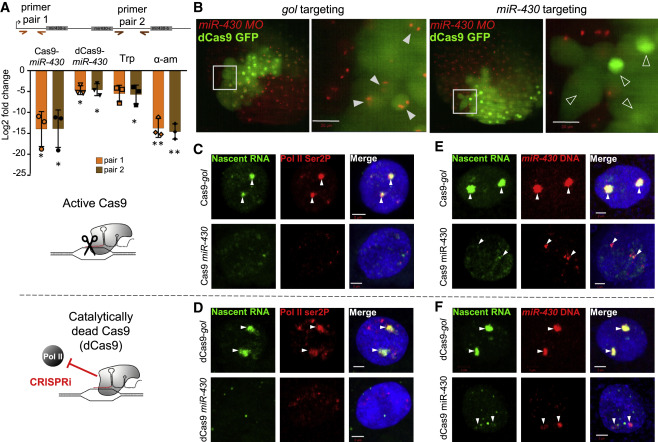
Fig. 5 Manipulations that limit transcription of the miR-430 cluster also disrupt the transcription body
(A) Schematic of a single miR-430 triplet showing the position of two qRT-PCR primer sets (orange and brown arrows). Chart shows relative levels of miR-430 RNA at the 512-cell stage, normalized to 5S rRNA, following miR-430 promoter targeting by Cas9 or dCas9, and triptolide (Trp) or α-amanitin (α-am) treatment, compared with control manipulations of active Cas9 targeting gol splice junction, dCas9 targeting gol splice junction and injection control, respectively. Data are based on three biological repeats. Error bars represent standard deviation and asterisks indicate significance, ∗p < 0.05 and ∗∗p < 0.005 (unpaired t test).
(B) miR-430 MO (red) labeled transcription bodies in live 512-cell stage embryos following either miR-430 promoter or gol splice junction mosaic targeting with dCas9-GFP (green). Gray boxes indicate enlarged region shown on the right; gol targeted: 10 embryos, miR-430 targeted: 8 embryos. white arrowheads: nuclei with two transcription bodies, open arrowheads: nuclei without detectable transcription bodies, scale bars, 20 μm.
(C and D) EU labeling of nascent RNA (green), Pol II ser2P (red) immunostaining, and DAPI (blue) in 512-cell-stage embryos: active Cas9; gol targeted: 6 embryos, 31 nuclei; miR-430 targeted: 6 embryos, 28 nuclei (C). Catalytically dead Cas9; gol targeted: 8 embryos, 52 nuclei; miR-430 targeted: 5 embryos, 29 nuclei (D).
(E and F) EU labeling of nascent RNA (green) combined with FISH for miR-430 DNA (red) and DAPI (blue) at 512-cell stage: active Cas9; gol targeted: 4 embryos, 21 nuclei. miR-430 targeted: 4 embryos, 41 nuclei (E). Catalytically dead Cas9; gol targeted: 5 embryos, 41 nuclei. miR-430 targeted: 8 embryos, 66 nuclei (F). White arrowheads (C–F) remnants of transcription body, scale bars, 2 μm.
See also Figure S4.
Reprinted from Developmental Cell, 58, Hadzhiev, Y., Wheatley, L., Cooper, L., Ansaloni, F., Whalley, C., Chen, Z., Finaurini, S., Gustincich, S., Sanges, R., Burgess, S., Beggs, A., Müller, F., The miR-430 locus with extreme promoter density forms a transcription body during the minor wave of zygotic genome activation, 155170.e8155-170.e8, Copyright (2023) with permission from Elsevier. Full text @ Dev. Cell