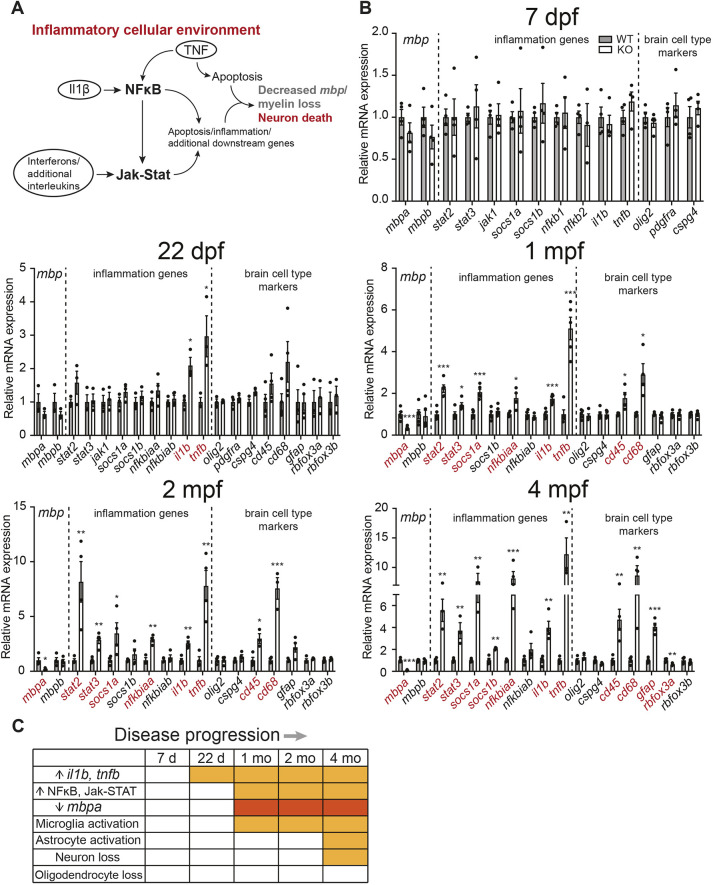
Neuroinflammatory response precedes mbpa loss in psap+63/+63 zebrafish. (A) Schematic of inflammation-driven disease progression in the psap KO model. (B) Relative expressions of representative markers for myelination, inflammation and major brain cell populations at 7 dpf, 22 dpf, 1 mpf (33 dpf), 2 mpf and 4 mpf. Representative data from two independent qRT-PCR datasets; n=3-5 WT and n=3-5 psap+63/+63 for each dataset. Data points for each dataset were normalized to the average of the WT samples in that set. Data show the mean±s.e.m. Two-tailed unpaired Student's t-test was used. *P<0.05; **P<0.01, ***P<0.001. (C) Table illustrating the onset of major cellular events in psap+63/+63 zebrafish relative to WT siblings, based on first appearance of statistically significant changes in the corresponding marker genes. Red boxes denote statistically significant time points for mbpa; orange boxes denote statistically significant time points for all additional pathway markers.
This image is the copyrighted work of the attributed author or publisher, and
ZFIN has permission only to display this image to its users.
Additional permissions should be obtained from the applicable author or publisher of the image.
Full text @ Dis. Model. Mech.
Your Input Welcome
Thank you for submitting comments. Your input has been emailed to ZFIN curators who may contact you if
additional information is required.
Oops. Something went wrong. Please try again later.