IMAGE

Fig. 2.

ID
ZDB-IMAGE-230707-29
Source
Figures for Zhang et al., 2023
Image
Figure Caption

Fig. 2.

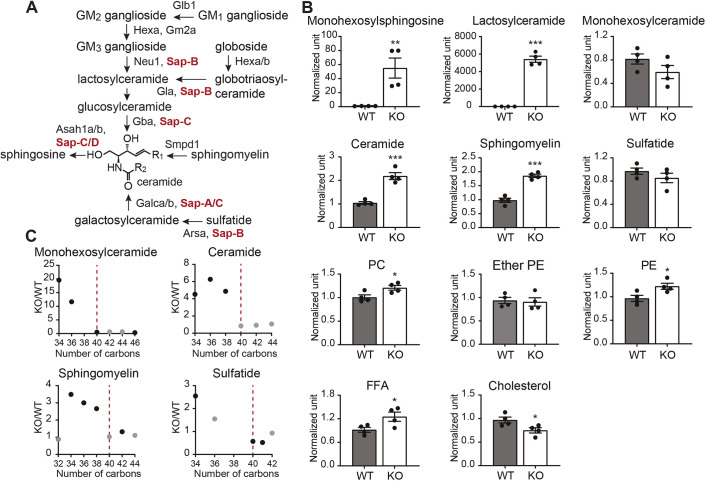
Psap KO zebrafish exhibit altered lipid metabolism. (A) The sphingolipid catabolic pathway. The illustration is based on Özkara (2004). (B) Relative levels of major lipid families in 4 mpf WT (n=4) and psap+63/+63 (n=4) brains. PC, phosphatidylcholine; PE, phosphatidylethanolamine; FFA, free fatty acid. (C) KO/WT fold changes versus the number of carbons in the ceramide core of the lipid species for selected sphingolipid families, demonstrating a rapid drop in the amplitude of lipid accumulation at around 40 carbon atoms, corresponding to a C22 acyl chain for the majority of sphingolipids given the prevalence of the d18 backbone in adult zebrafish brains (Zhang et al., 2019). Data points in black are statistically significant. Additional lipidomics data are in Fig. S3 (4 mpf WT and psap−14/−14 brains) and Tables S1 and S2. Data show the mean±s.e.m. Two-tailed unpaired Student's t-test was used. *P<0.05, **P<0.01, ***P<0.001.

Acknowledgments
This image is the copyrighted work of the attributed author or publisher, and ZFIN has permission only to display this image to its users. Additional permissions should be obtained from the applicable author or publisher of the image. Full text @ Dis. Model. Mech.