
IMAGE
Fig. 1
- ID
- ZDB-IMAGE-230707-23
- Publication
- Medina-Gomez et al., 2023 - Bone mineral density loci specific to the skull portray potential pleiotropic effects on craniosynostosis
- All Figures
- Figures for Medina-Gomez et al., 2023
Image
|
Figure Caption
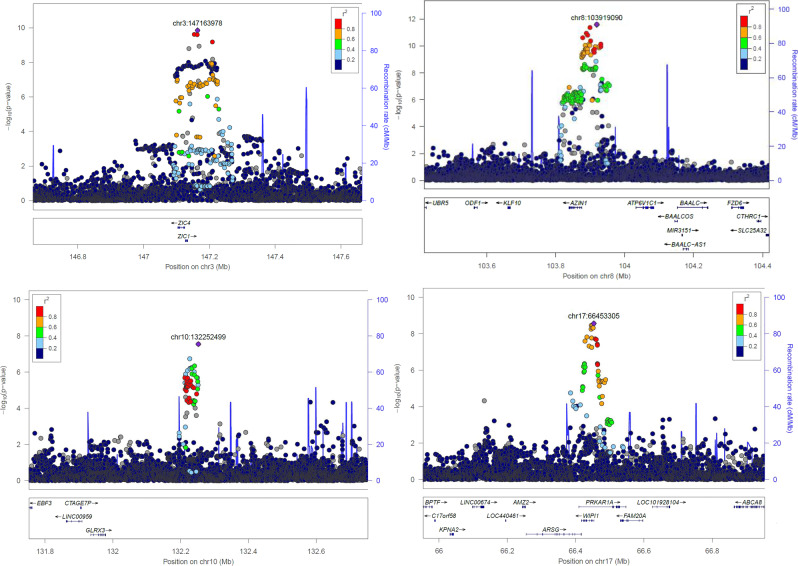
Fig. 1
Regional plots for the four novel loci associated with SK-BMD (
Circles show GWAS meta-analysis P-values and position of SNPs for the overall meta-analysis (
Acknowledgments
This image is the copyrighted work of the attributed author or publisher, and
ZFIN has permission only to display this image to its users.
Additional permissions should be obtained from the applicable author or publisher of the image.
Full text @ Commun Biol