
|
Fig. 4
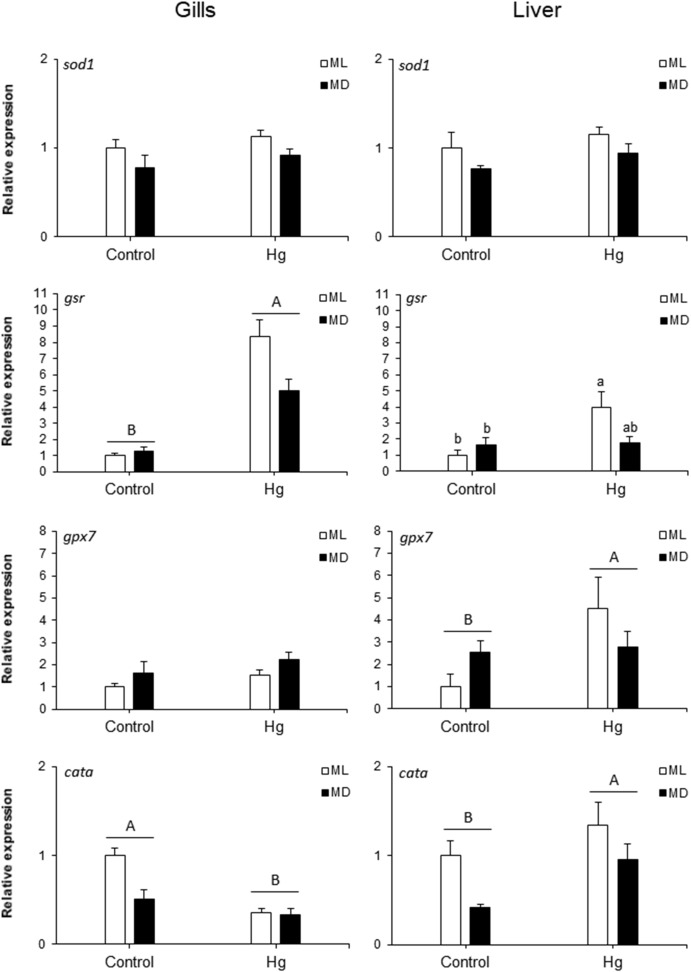
Fig. 4. Relative expression of antioxidant genes in gills (left panels) and liver (right panels) of control and Hg-exposed zebrafish at ML (white bars) and MD (black bars): sod1, gpx7, gsr and cata. Data are shown as the mean ± SE (n = 7). Capital superscript letters indicate statistically significant differences between treatment means (ANOVA II, p ≤ 0,05). Lower case superscript letters indicate statistically significant differences between all experimental groups when a significant interaction “treatment x time” was found (ANOVA II, p ≤ 0.05 followed by multiple pairwise comparisons, Bonferroni-adjusted, p < 0.05).