
|
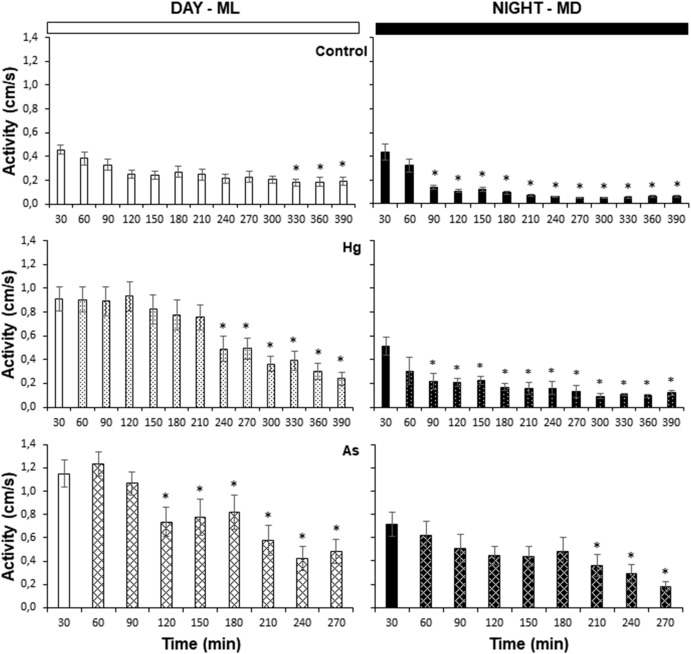
Fig. 3 Fig. 3. Mean locomotor activity level (cm/s) of control (top), Hg- (middle) and As-exposed (bottom) zebrafish at ML (left panels) and MD (right panels) (n = 14 fish/trial). Each bar indicates the average activity level during 30 min ±SE. White and black bars represent activity data from non-exposed fish (control) and before adding the metals to the aquarium at ML and MD, respectively. Pattern filled bars represent data from Hg- (dots) and As-exposed (grid) fish. Asterisks (*) indicate statistically significant differences in mean activity levels between the first and the subsequent 30-min slots (GLM Repeated measures followed by pairwise comparisons, Bonferroni adjusted, p < 0.05).