
Image
|
Figure Caption
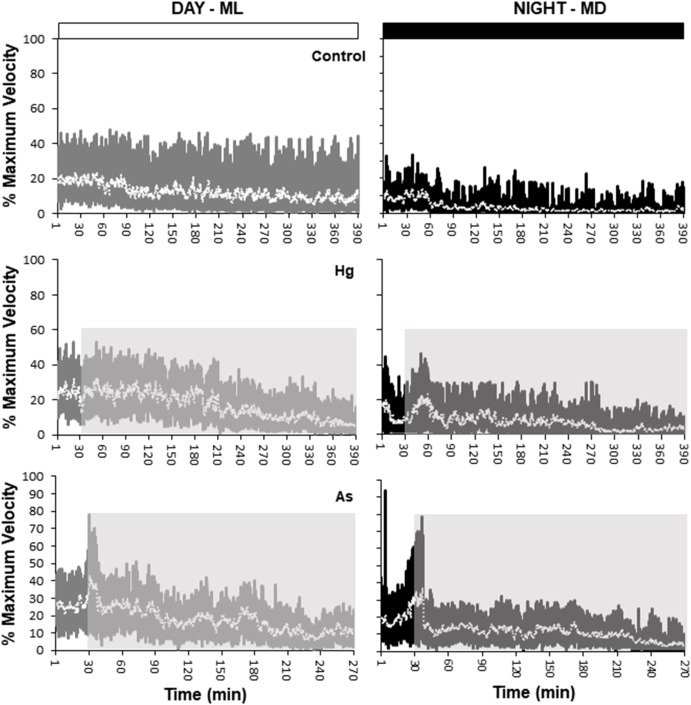
Fig. 2 Fig. 2. Swimming activity of control (top), Hg- (middle) and As-exposed (bottom) zebrafish at ML (left panels) and MD (right panels) (n = 14 fish/trial). Activity levels were normalized as the percentage of maximum velocity displayed by fish during each trial. As and Hg exposure period are indicated by a grey rectangle.
Acknowledgments
This image is the copyrighted work of the attributed author or publisher, and
ZFIN has permission only to display this image to its users.
Additional permissions should be obtained from the applicable author or publisher of the image.
Full text @ Chemosphere