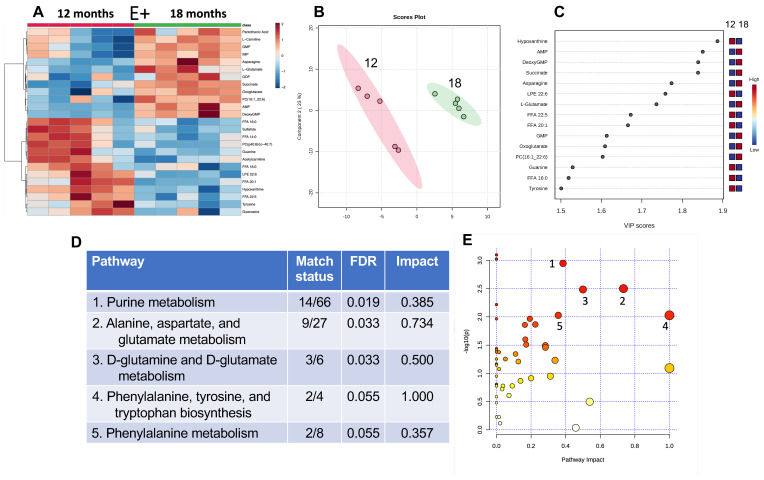
Analysis of E+ fish muscles at 12 vs. 18 months. The heatmap (A) shows the top 25 metabolites separating groups and their relative abundances per sample (red represents a higher concentration per sample while blue indicates a lower one). The partial least squares-discriminant analysis (PLS-DA) scores plot (B) separates 12- and 18-month E+ muscle samples by feature differences and displays a 95% confidence region around samples. Important features plot displays variable importance in projection (VIP) (C) of the PLS-DA and provides an estimation of the discriminatory power of each metabolite with a score. Larger VIP scores indicate greater discriminatory power in the PLS-DA models. The table (D) lists the top values shown in the graph of pathway analysis, while figure (E) displays pathway analysis by ranking metabolites by p-value (shown as −log10(p)) and pathway impact referenced against the KEGG (Kiyoto Encyclopedia of Genes and Genomes) Pathway Database. Red indicates highest impacts, clear the lowest, yellow and orange are intermediate.
Acknowledgments
This image is the copyrighted work of the attributed author or publisher, and
ZFIN has permission only to display this image to its users.
Additional permissions should be obtained from the applicable author or publisher of the image.
Full text @ Antioxidants (Basel)
Your Input Welcome
Thank you for submitting comments. Your input has been emailed to ZFIN curators who may contact you if
additional information is required.
Oops. Something went wrong. Please try again later.