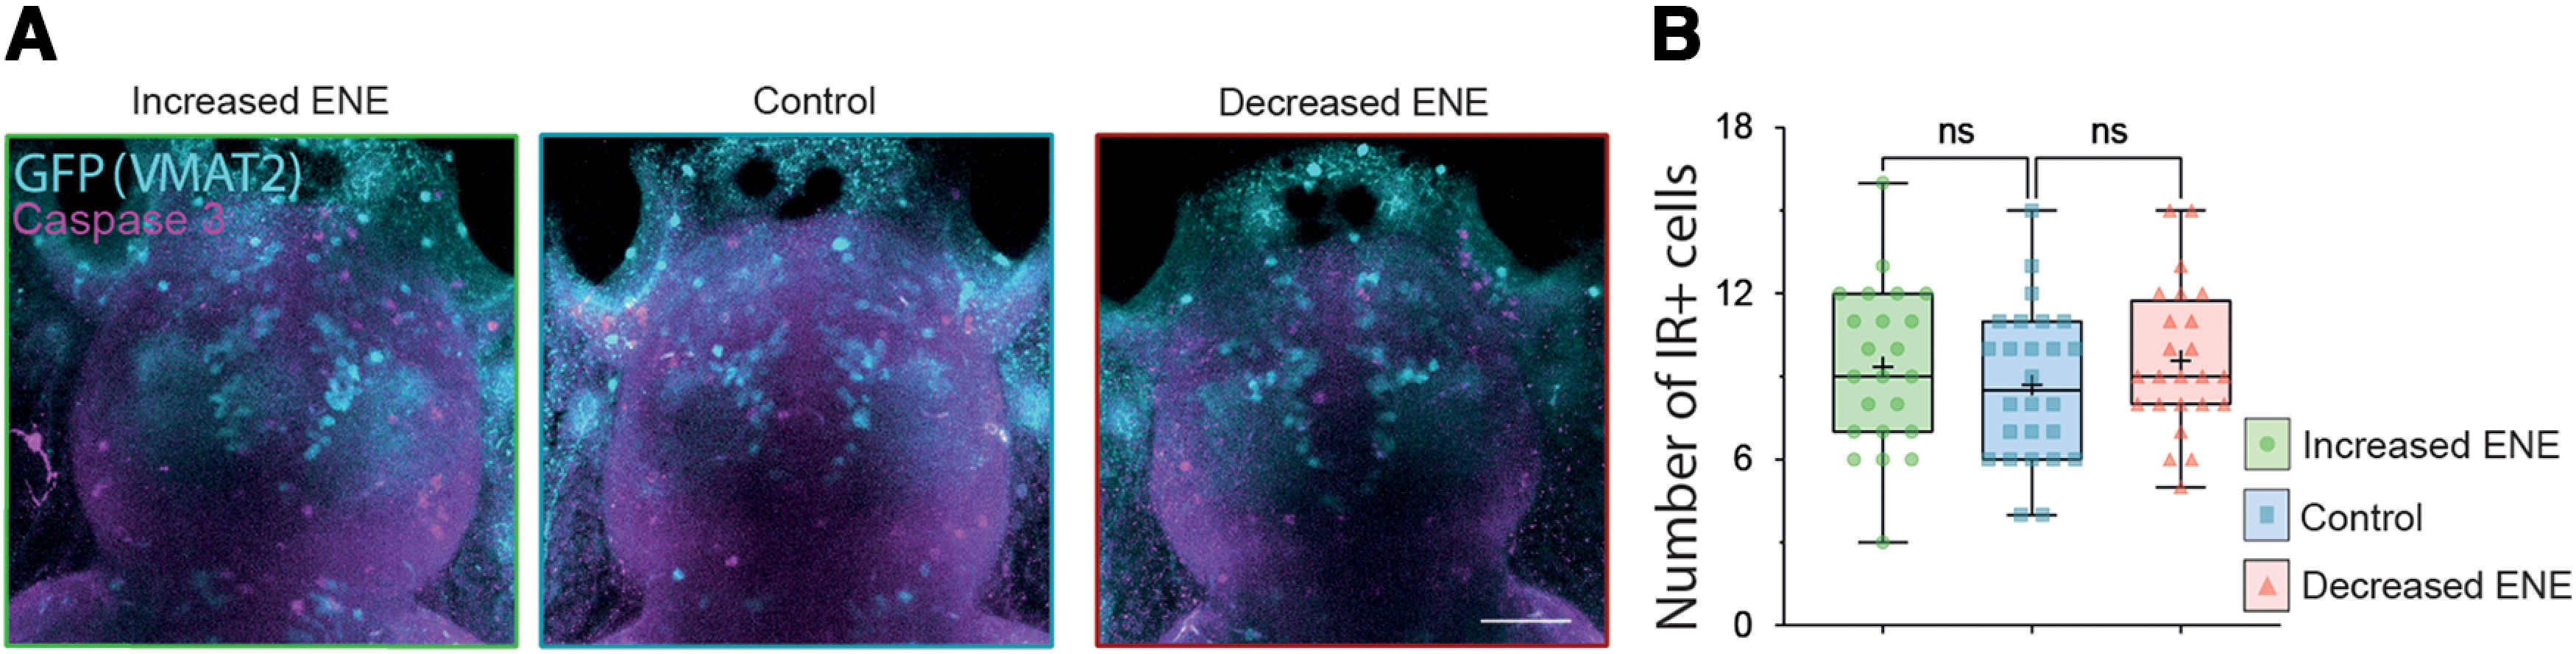
Absence of changes in programmed cell death following modifications of ENE. A, Maximum projection of confocal z series of the brain of 6- to 7-dpf Tg(Et.vMAT2:eGFP) larvae, following ENE increase (left image, boxed in green), in control conditions (middle image, boxed in blue), and following ENE decrease (right image, boxed in red). Immunostaining to caspase-3 (magenta) and GFP (cyan) are shown as merged channels. Scale bars = 50 μm. B, Boxplots showing the number of the caspase-3+ IR cells counted in the telencephalon following ENE increase (green), in control conditions (blue) and following ENE decrease (red). KW test, 23 < n < 26 telencephalon from four independent experiments. ns = non significant.
Acknowledgments
This image is the copyrighted work of the attributed author or publisher, and
ZFIN has permission only to display this image to its users.
Additional permissions should be obtained from the applicable author or publisher of the image.
Full text @ eNeuro
Your Input Welcome
Thank you for submitting comments. Your input has been emailed to ZFIN curators who may contact you if
additional information is required.
Oops. Something went wrong. Please try again later.