IMAGE

Figure 2.

ID
ZDB-IMAGE-230630-58
Source
Figures for Bataille et al., 2023
Image
Figure Caption

Figure 2.

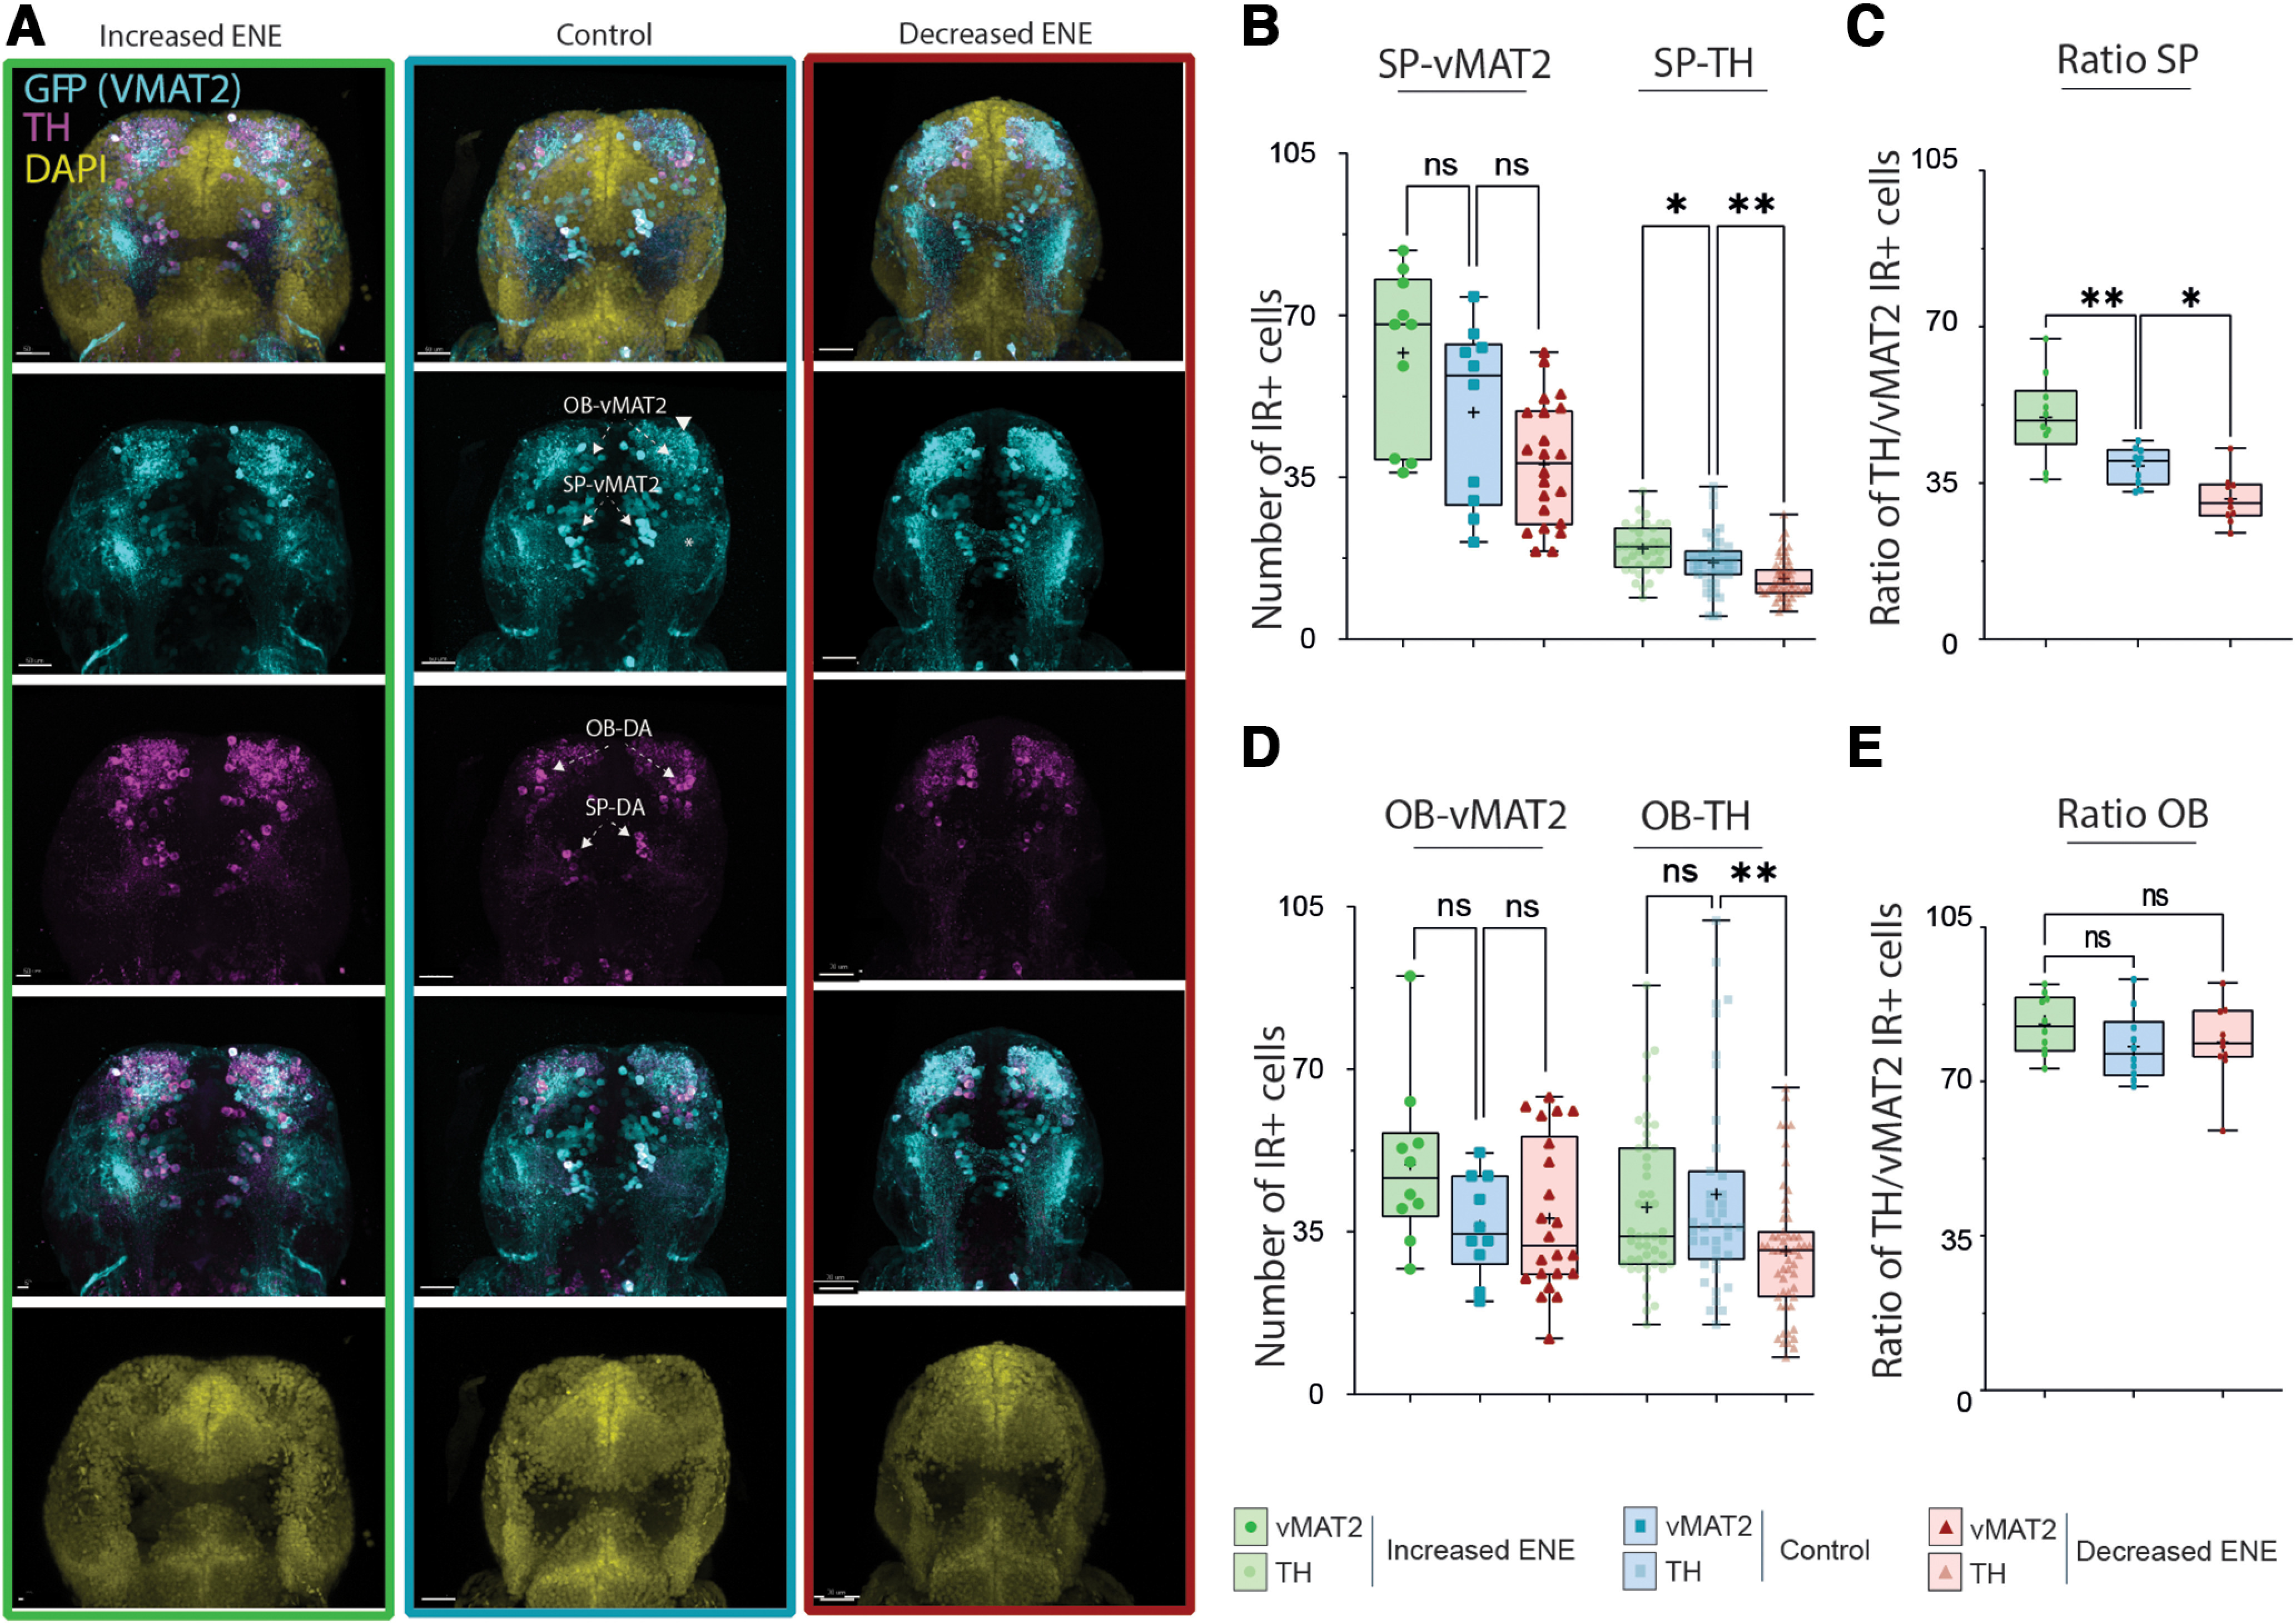
Effects of ENE on the expression of dopaminergic markers in the zebrafish larval subpallium and olfactory bulb. A, Maximum projection of confocal z series of the brain of 6- to 7-dpf Tg(Et.vMAT2:eGFP) larvae, following ENE increase (left column, boxed in green), in control conditions (middle column, boxed in blue), and following ENE decrease (right column, boxed in red). Immunostaining to TH (magenta) and GFP (cyan) and DAPI (yellow) are shown as composite image (top) as well as for each color channels. Scale bars = 50 μm. B–E, Boxplots showing the number of cells IR+ for dopaminergic markers in the SP (B) and the OB (D) from six independent experiments, in control conditions (blue), following ENE increase (green) and following ENE decrease (red). B, Left, Number of SP-vMAT2+ cells, KW test, 6 < n < 16. Right, Number of SP-TH+ cells, KW test, 34 < n < 49. C, Proportion of vMAT2+ cells being also TH1+ in the SP, ANOVA test, n = 24. D, Left, Number of OB-vMAT2+ cells, KW test, 6 < n < 16. Right, OB-TH+ cells, KW test, 34 < n < 49. E, Proportion of vMAT2+ cells being also TH1+ in the SP, ANOVA test, n = 24. *p < 0.05, **p < 0.01, ns = non significant.

Acknowledgments
This image is the copyrighted work of the attributed author or publisher, and ZFIN has permission only to display this image to its users. Additional permissions should be obtained from the applicable author or publisher of the image. Full text @ eNeuro