IMAGE

FIGURE 3

ID
ZDB-IMAGE-230625-7
Source
Figures for Liu et al., 2023
Image
Figure Caption

FIGURE 3

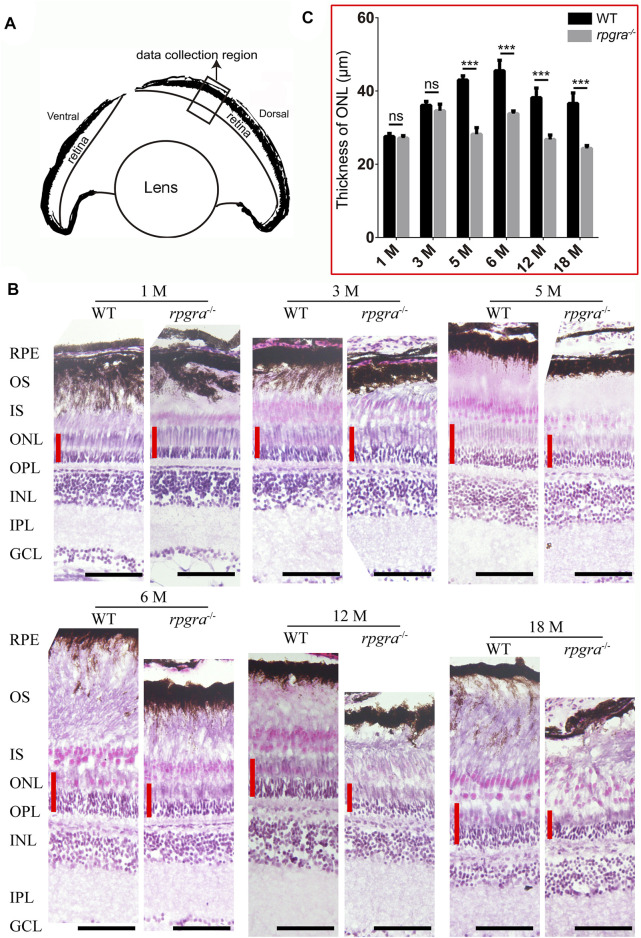
Retinal degeneration in rpgra−/− zebrafish revealed by histologic analysis. (A) Schematic showing the data collected region of WT or rpgra−/− retina. (B) Retinal sections from the dark-adapted WT and rpgra−/− zebrafish stained with hematoxylin and eosin (H&E). The red lines indicate the thicknesses of the ONL. RPE, retinal pigment epithelium; OS, outer segment; IS, inner segment; ONL, outer nuclear layer; OPL, outer plexiform layer; INL, inner nuclear layer; IPL, inner plexiform layer; GCL, ganglion cell layer. Scale bars, 50 μm. (C) Statistical results of the thickness of the retinal outer nuclear layer in each month’s zebrafish (n = 8) were analyzed using a two-tailed Student’s t-test and shown as mean ± SD. **, 0.001 < p < 0.01; ***, p < 0.001.

Acknowledgments
This image is the copyrighted work of the attributed author or publisher, and ZFIN has permission only to display this image to its users. Additional permissions should be obtained from the applicable author or publisher of the image. Full text @ Front Cell Dev Biol