
|
Fig 4
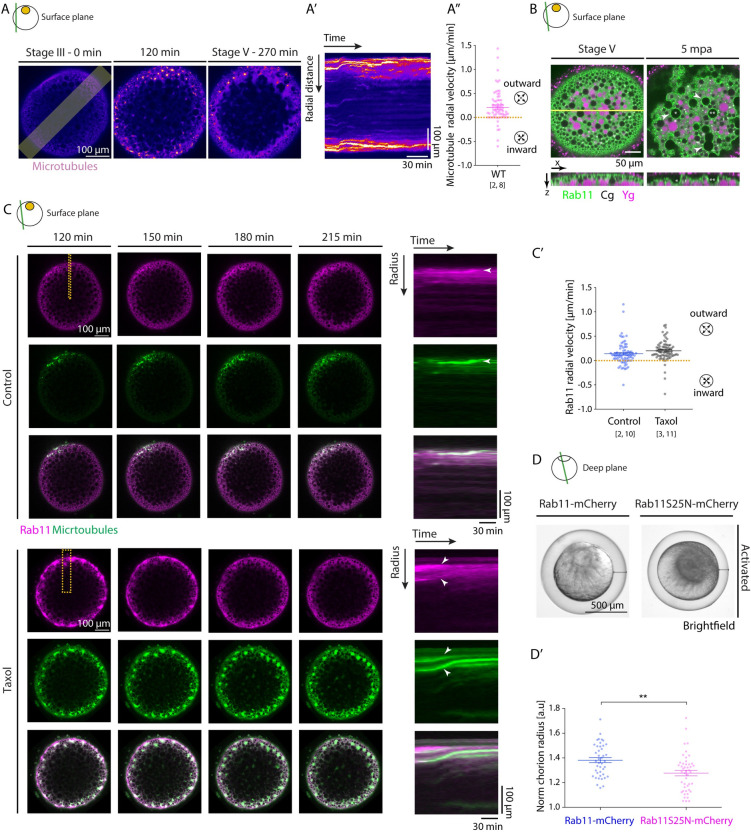
(A) Left: Fluorescence images of stage III Tg(Xla.Eef1a1:dclk2a-GFP) oocytes labeling microtubules before (stage III) and 120 and 270 min after maturation onset. The lateral line indicates the region used for acquiring the kymograph in (A’). (A’) Kymograph of microtubule intensity along the lateral axis of the oocyte shown in (A) as a function of time. (A”) Microtubule aster radial velocity during maturation onset (N = 2 experiments, n = 8 oocytes). See Table A in S4 Data for underlying data. (B) Fluorescence images of Tg(actb2:Rab11a-NeonGreen) oocytes marking Rab11-positive vesicles (green) and exposed to Lysotracker to label Ygs (magenta) at stage V (mature oocyte/egg, left) and 5 min after activation (mpa) with E3 medium (right). Cgs (black) are identified by their exclusion of Lysotracker and the ooplasmic signal. The yellow line indicates the region used for displaying the orthogonal view (bottom images). Asterisks mark exemplary Cg undergoing exocytosis, and arrowheads denote the localization of Rab11 on Cg prior to/during their exocytosis. (C) Left: Fluorescence images of stage III Tg(actb2:Rab11a-NeonGreen) oocytes marking Rab11-positive vesicles (magenta, top rows) and injected with 400 pg of DCLK-mKO2 mRNA to label microtubules (green, middle rows) 120, 150, 180, and 215 min after maturation onset in control oocytes (WT, top panels) or oocytes exposed to 50 μM Taxol (bottom panels). Overlaid images are shown in the bottom rows. Dashed lines indicate the regions used for acquiring kymographs on the right. Right: Kymographs acquired along the marked area of the oocytes shown on the left as a function of time. Arrowheads point at exemplary Rab11-positive vesicles or microtubule asters moving towards the cortex. (C’) Rab11 radial velocity during maturation onset for control oocytes (left, N = 2, n = 10) and oocytes exposed to 50 μM Taxol (right, N = 3, n = 11). See Table B in S4 Data for underlying data. (D) Brightfield images of oocytes injected with 350 pg of Rab11-mcherry (left) or Rab11S25N-mCherry (right; DN) mRNA, induced to undergo oocyte maturation for 270 min and activated consequently by exposure to E3 medium for 30 min. Black lines demarcate the distance between the egg and its overlaying chorion. (D’) Chorion elevation, measured as chorion diameter normalized to the oocyte diameter, of oocytes injected with 350 pg of Rab11-mcherry (blue, control, N = 3, n = 42) or Rab11S25N-mCherry (magenta, N = 3, n = 46) mRNA. See Table C in S4 Data for underlying data. Schematics in each panel demarcate the imaging plane used for obtaining the images in that panel. Error bars, SEM. Mann–Whitney test, **p = 0.001. Cgs, cortical granules; DN, dominant negative; WT, wild-type; Ygs, yolk granules.