
|
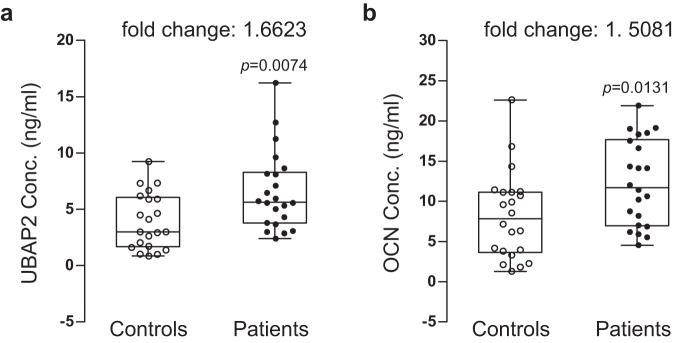
Fig. 7
Protein concentration and fold changes in aUBAP2 and osteoblast differentiation marker b OCN between blood plasmas from normal controls and patients with osteoporosis are shown. Blood plasmas were separated from whole peripheral blood samples from the normal control postmenopausal women (n = 21) and postmenopausal women with osteoporosis (n = 22). Protein concentrations (ng/ml) in plasmas were determined by analysis of enzyme-linked immunosorbent assay data. The concentrations were plotted by opened and closed circles. The minimum to maximum concentration and median values are shown in box-and-whisker plots. Fold changes in mean values between groups are indicated. All experiments were repeated three times with duplicated samples. Exact p-values between the groups were calculated with an unpaired two-tailed Student’s t-test. Source data are provided as a Source Data file.