IMAGE

Figure 7

ID
ZDB-IMAGE-230619-27
Source
Figures for Fleischhauer et al., 2023
Image
Figure Caption

Figure 7

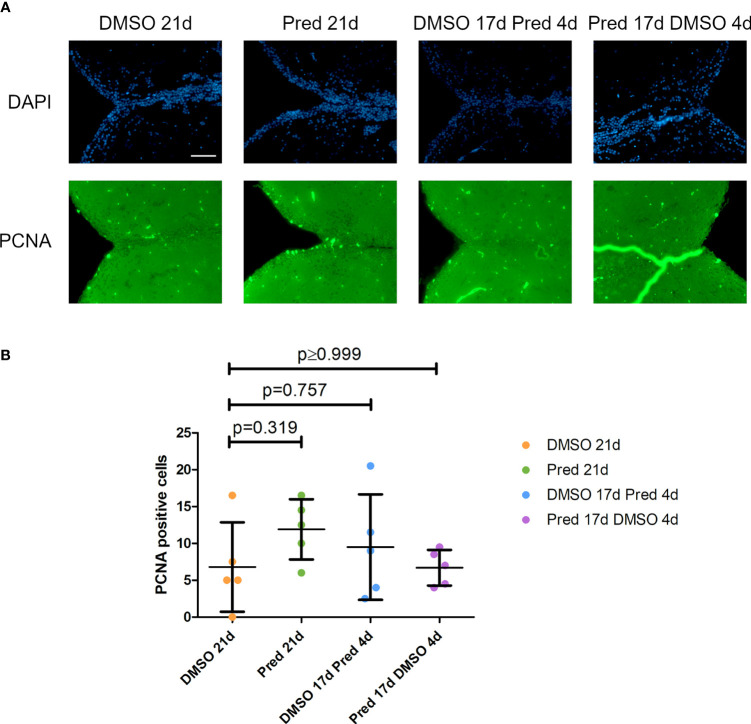
Cell proliferation in the telencephalon of zebrafish. (A) Immunohistochemical staining against PCNA and nuclear counterstain with DAPI. From left to right: fish underwent 21 days of DMSO, 21 days of prednisolone, 17 days of DMSO followed by 4 days of prednisolone and 17 days of prednisolone followed by 4 days of DMSO treatment. Scalebar 50 µm. (B) Quantification of PCNA+ cells in the telencephalon. Data are mean ± SD of PCNA+ cells in the different groups (21 days of DMSO, 21 days of prednisolone, 17 days of DMSO followed by 4 days of prednisolone and 17 days of prednisolone followed by 4 days of DMSO. Each dot represents one biological replicate. Parametric testing because of normal distribution of the data. Statistical significance was tested by post-hoc Dunnett’s multiple comparison after one-way ANOVA. n=5 (4 females, 1 male in DMSO 21d, DMSO 17d Pred 4d, Pred 17 d DMSO 4d; 5 females in Pred 21d) in all groups with 2 sections per individual.

Acknowledgments
This image is the copyrighted work of the attributed author or publisher, and ZFIN has permission only to display this image to its users. Additional permissions should be obtained from the applicable author or publisher of the image. Full text @ Front Endocrinol (Lausanne)