IMAGE

Figure 2

ID
ZDB-IMAGE-230619-22
Source
Figures for Fleischhauer et al., 2023
Image
Figure Caption

Figure 2

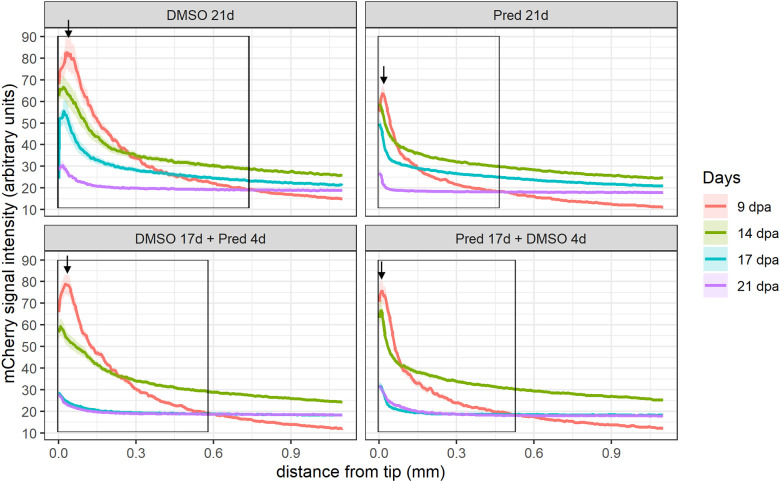
Quantification of the 7xTCF-Xia.Siam:nlsmCherry Wnt reporter expression in the fin regenerate. Lines represent mean ± SEM of mCherry signal intensity for the four different treatments measured at 9 dpa, 14 dpa, 17 dpa, and 21 dpa. Signal was measured from the tip towards the amputation plane. Boxes indicate “Wnt-active zone” at 9 dpa, defined as levels beyond baseline expression levels detected at 21 dpa (i.e. point of intersection of 9 dpa curve with 21 dpa curve). n (DMSO 21d,9/14/17/21dpa) = 5 (4 females, 1 male); n (Pred 21d,9dpa) = 8 (6 females, 2 males), n (Pred 21d,14dpa) = 7 (6 females, 1 male), n (Pred 21d,17/21dpa) = 6 (6 females); n (DMSO 17d Pred 4d,9/14dpa) = 8 (6 females, 2 males), n (DMSO 17d Pred 4d,17/21dpa) = 7 (6 females, 1 male); n (Pred 17d DMSO 4d,9dpa) = 8 (6 females, 2 males), n (Pred 17d DMSO 4d,14/17/21dpa) = 7 (6 females, 1 male).

Acknowledgments
This image is the copyrighted work of the attributed author or publisher, and ZFIN has permission only to display this image to its users. Additional permissions should be obtained from the applicable author or publisher of the image. Full text @ Front Endocrinol (Lausanne)