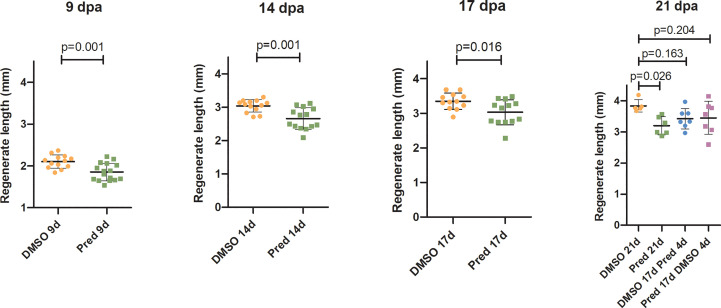
IMAGE

Figure 1

ID
ZDB-IMAGE-230619-21
Source
Figures for Fleischhauer et al., 2023
Image
Figure Caption

Figure 1

Quantification of fin regenerate length during the course of regeneration. Bars represent mean ± SD of fin outgrowth after amputation under different treatment conditions, measured at different times post amputation. Each dot represents one biological replicate. Parametric testing because of normal distribution of data. Statistical significance at 9 dpa, 14, dpa and 17 dpa was tested by two-tailed t-tests and at 21 dpa by post-hoc Dunnett’s multiple comparison after one-way ANOVA. n (DMSO,9dpa) = 13 (10 females, 3 males), n (Pred,9dpa) = 16 (12 females, 4 males), n (DMSO,14dpa) = 13 (10 females, 3 males), n (Pred,14dpa) = 14 (12 females, 2 males), n (DMSO,17dpa) = 12 (10 females, 2 males), n (Pred,17dpa) = 13 (12 females, 1 male), n (DMSO 21d,21dpa) = 5 (4 females, 1 male), n (Pred 21d,21dpa) = 6 (6 females), n (DMSO 17d Pred 4d,21dpa) = 7 (6 females, 1 male), n (Pred 17d DMSO 4d,21dpa) = 7 (6 females, 1 male).

Acknowledgments
This image is the copyrighted work of the attributed author or publisher, and ZFIN has permission only to display this image to its users. Additional permissions should be obtained from the applicable author or publisher of the image. Full text @ Front Endocrinol (Lausanne)