
|
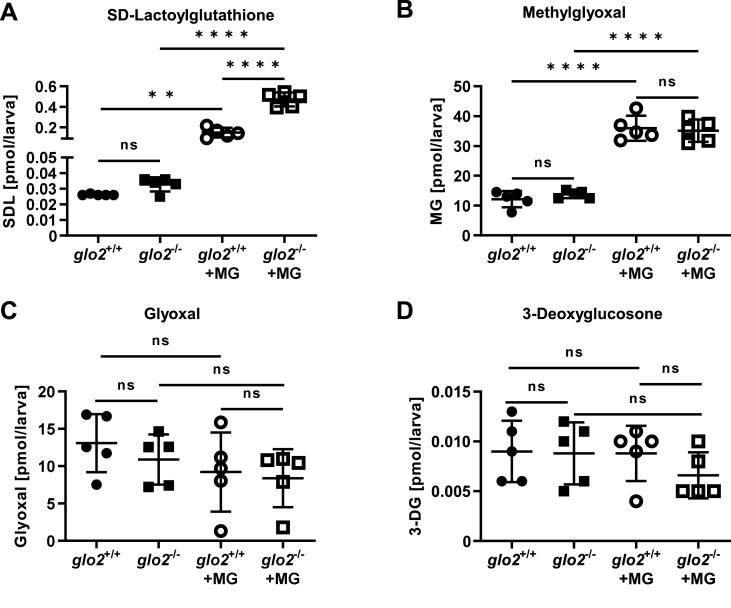
Fig. 3
glo2−/−zebrafish showed an increase in SD-Lactoylglutathione after incubation in methylglyoxal. A) Incubation of the larvae in 500 μM MG caused a tenfold increase of SDL, with a more pronounced increase of SDL in glo2−/− larvae compared to glo2+/+ larvae, (B) but showed no increase in baseline MG. Incubation with 500 μM MG caused an equal increase of MG in glo2−/− and glo2+/+ larvae. C) The levels of glyoxal were unchanged in glo2−/− larvae and were uninfluenced by incubation in 500 μM MG. D) The levels of 3-deoxyglucosone were unchanged in glo2−/− larvae and were uninfluenced by incubation in 500 μM MG. Measurements were conducted using LC-MS/MS. One datapoint represents one clutch of 46 larvae, collected at 120 hpf. For statistical analysis normality tests were used for all samples, followed by unpaired t-test (A, B, C, D), or Mann-Whitney test (A, C, D). Data presented as mean ± SD. N = 5. ns = p > 0.05, ** = p < 0.01, **** = p < 0.0001. SDL: SD-Lactoylglutathione, MG: methylglyoxal, 3-DG: 3-deoxyglucosone, LC-MS: liquid chromatography/mass spectrometry.