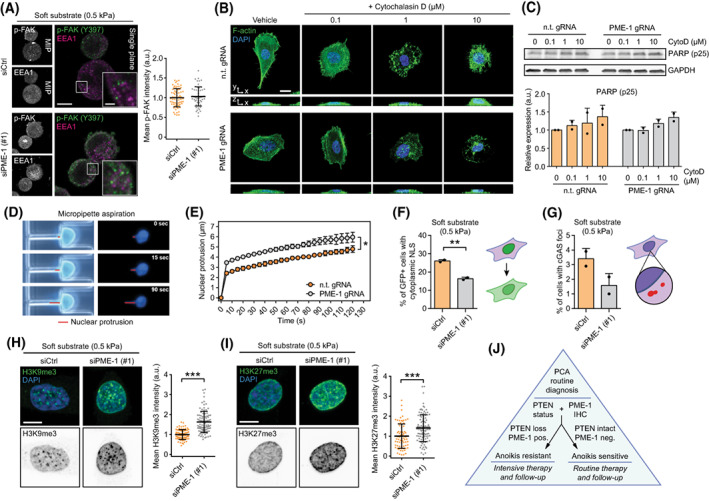
IMAGE

Fig. 5

ID
ZDB-IMAGE-230613-58
Source
Figures for Aakula et al., 2022
Image
Figure Caption

Fig. 5

The potential mechanisms for PME‐1‐mediated anoikis resistance. (A) Immunofluorescence images (left) and quantification (right) depicting phosphorylated FAK (Y397) and early endosomal marker EEA1 in control and PME‐1‐depleted PC‐3 cells grown on soft (0.5 kPa) hydrogels for 24 h. Scale bar, 10 μm (main), 2 μm (inset). Mean ± SD from a representative of two independent experiments. (B) Fluorescence images depicting filamentous actin in control and PME‐1 KO PC‐3 cells treated with DMSO or increasing concentrations of Cytochalasin D (0.1–10 μm). Scale bar, 20 μm. Shown is a representative of two independent experiments. (C) Western blot (top) and quantification (bottom) displaying PARP cleavage in PC‐3 cells upon actin cytoskeleton disruption with Cytochalasin D. Mean ± SD of two independent experiments. (D, E) Images (D) and quantification (E) showing nuclear deformation in PC‐3 cells subjected to micropipette aspiration, as described in [46], over the course of 2 min. Mean ± SD of three independent experiments. *P < 0.05, Welch's t‐test. (F, G) Quantification of GFP‐NLS‐positive cells with cytoplasmic GFP signal (F) and the percentage of transfected cells with visible cGAS‐mCherry foci (G), respectively, in siCtrl‐ and siPME‐1‐treated cells grown on soft (0.5 kPa) substrate. Both readouts serve as a surrogate measure of compromised nuclear envelope. Mean ± SD of two independent experiments. **P < 0.01, Welch's t‐test (H–I). Immunofluorescence images and quantification depicting H3K9me3 (H) and H3K27me3 (I) levels in transiently PME‐1‐depleted and control PC‐3 cells, 48 h post‐transfection and 24 h after seeding on soft (0.5 kPa) substrate. Scale bar, 10 μm. Mean ± SD, representative of two independent experiments. ***P < 0.001, Mann–Whitney test. (J) Schematic representation of a putative model for including PME‐1 and its role in anoikis sensitivity/resistance in PCa diagnostics and therapy decision.

Acknowledgments
This image is the copyrighted work of the attributed author or publisher, and ZFIN has permission only to display this image to its users. Additional permissions should be obtained from the applicable author or publisher of the image. Full text @ Mol. Oncol.