
Fig. 6
- ID
- ZDB-IMAGE-230612-6
- Publication
- Hodorovich et al., 2023 - Morphological and sensorimotor phenotypes in a zebrafish CHARGE syndrome model are domain-dependent
- All Figures
- Figures for Hodorovich et al., 2023
|
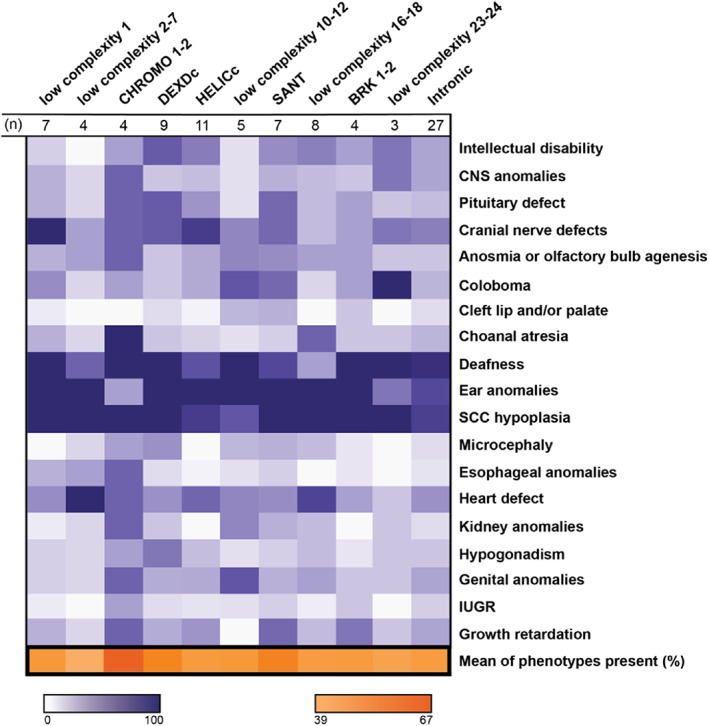
Fig. 6
Correlation of mutation location and phenotype penetrance in a cohort of CHARGE patients. Heat map displaying the frequency of patients with a specified phenotype and a mutation within a particular CHD7 domain; domains were determined by amino acid alignments (n = 89, n = 30 patients excluded from the original pool of 119 participants because of insufficient information or mutation did not align to a domain). CHD7 domains are represented by columns and phenotypes are represented by rows. Frequencies were calculated by the number of patients with a reported phenotype and mutation in the respective domain over the total number of patients within the same domain (purples). Final row represents the overall average phenotype frequency for a specific domain (oranges). Patient data was obtained from the paper Phenotype and genotype analysis of a French cohort of 119 patients with CHARGE syndrome, Legendre et al. 16 Darker colors indicate a higher frequency, with ranges indicated in the legends. CNS, central nervous system; IUGR, intrauterine growth restriction; SCC, semicircular canal.