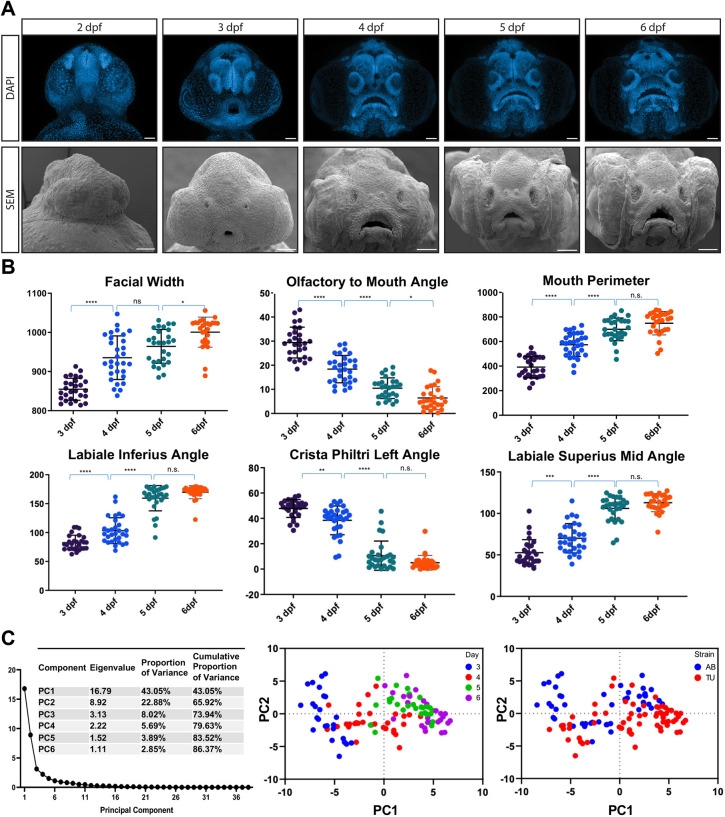
Time series of zebrafish craniofacial development. (A) Zebrafish larvae were analyzed from 2 to 6 dpf. Scanning electron microscope (SEM) images confirmed the soft tissue morphology captured by DAPI staining and confocal microscopy used in zFACE. (B) Changes in zFACE features were followed across developmental time points, and alterations in 28 measurements were determined (representative changes are shown in the graphs). The numbers of individual larvae for each group were as follows: n=30 at 3 dpf, n=31 at 4 dpf, n=28 at 5 dpf and n=28 at 6 dpf. Specifically, 20 zFACE measurements changed between 3 and 4 dpf, 12 changed between 4 and 5 dpf, and 6 nominally changed between 5 and 6 dpf. *P<0.05, **P<0.01, ***P<0.001, ****P<0.0001; n.s., not significant (one-way ANOVA). (C) Untransformed zFACE features were subjected to multivariate statistical testing using principal component analysis (PCA). The first two components captured 66% of the variance in the dataset. There were differences in developmental times that were captured across PC1, with no strain-specific differences observed. Scale bars: 50 µm.
Acknowledgments
This image is the copyrighted work of the attributed author or publisher, and
ZFIN has permission only to display this image to its users.
Additional permissions should be obtained from the applicable author or publisher of the image.
Full text @ Dis. Model. Mech.
Your Input Welcome
Thank you for submitting comments. Your input has been emailed to ZFIN curators who may contact you if
additional information is required.
Oops. Something went wrong. Please try again later.