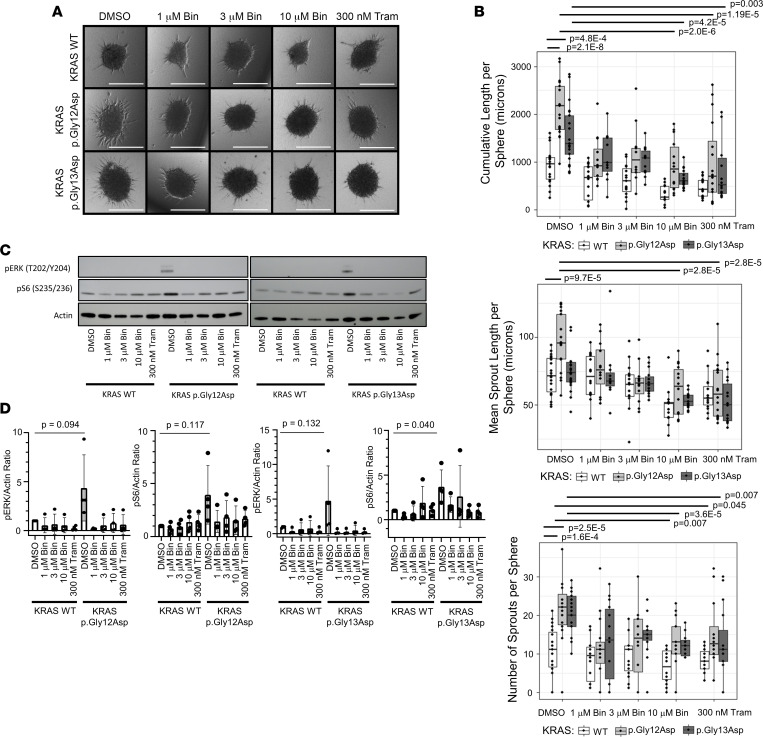
Figure 3
(A) Lymphatic organoids were transduced with KRAS WT, KRAS p.Gly12Asp, or KRAS p.G13D and treated with DMSO (control), 1 μM binimetinib, 3 μM binimetinib, 10 μM binimetinib, or 300 nM trametinib. Scale bars: 300 μm. (B) Quantitation of sprouting data from 3 independent experiments showing cumulative sprout length per sphere (top), mean sprout length per sphere (middle), and number of sprouts per sphere (bottom). In the box and whisker plots, the center line is the median, the lower and upper boundaries of the box are the 25% and 75% quartiles, and the whiskers extend to 1.5 times the interquartile range from the 25% and 75% quartiles. Two-sided Student’s t tests were performed to calculate significance. Comparisons were made between DMSO-treated WT and both DMSO-treated mutants, as well as each DMSO-treated mutant and all the drug treatments of that mutant; P values were corrected for multiple testing with the Benjamini and Hochberg FDR method. Bin, binimetinib; Tram, trametinib. (C) IB from in vitro organoid model. Cell lysates from HDLECs transduced with either KRAS WT, p.Gly12Asp, or p.Gly13Asp were analyzed with IB for pERK at T202 and Y204 or pS6 at S235/236 with actin as control and quantified. (D) Quantification of IB from 4 separate experiments, pERK or pS6 normalized to actin, normalized to WT + DMSO sample. Bars are means; error bars are SDs. Bin, binimetinib; Tram, trametinib.

