
|
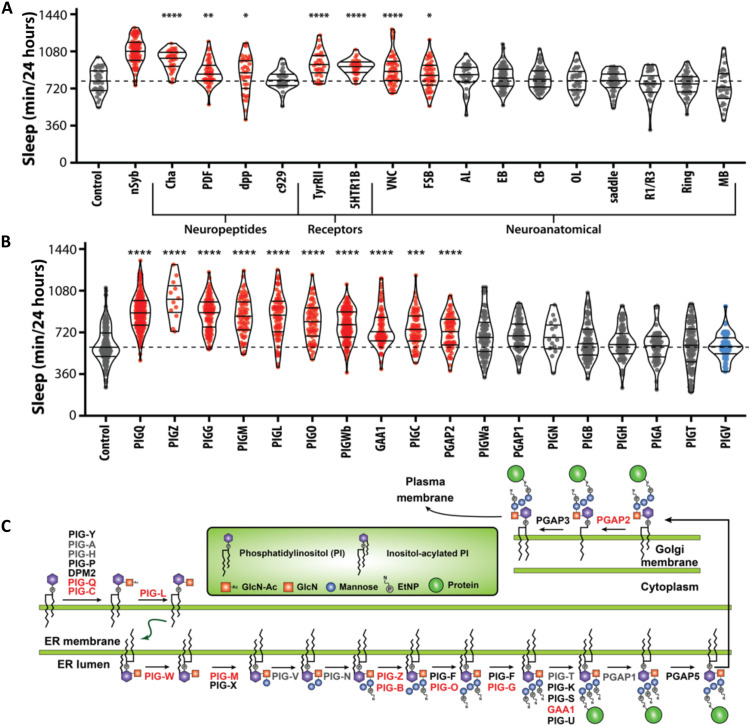
Fig. 3
(A) Knockdown of PIG-Q in multiple Drosophila neuronal subpopulations affects sleep duration (ANOVA: F18,756 = 25.21, P < 0.0001). The dashed line represents the mean of the control line. PIG-Q significant increased sleep when knocked down pan-neuronally (nSyb; P < 0.0001); cholinergic neurons (Cha; P < 0.0001); dpp-expressing neurons (dpp; P = 0.0334); circadian pacemaker neurons (PDF; P = 0.0025); tyramine II receptor neurons (TyRII; P < 0.0001); serotonin receptor IB neurons (5HT1b; P < 0.0001); the ventral nerve cord (VNC; P < 0.0001); and the fan-shaped body (fsb; P = 0.0478). (B) Knockdown of multiple genes in the PIG pathway affects sleep duration (ANOVA: F18,1251 = 39.63, P < 0.0001). The dashed line indicates the mean of the control line. For violin plots, the median and 25th and 75th percentiles are shown (solid black lines). Each dot represents an individual fly; red indicates sleep duration that is significantly higher than the control, gray indicates sleep that is not significantly different, and blue indicates sleep that is significantly lower than the control as revealed by Dunnett’s multiple comparisons test. *P < 0.05, **P < 0.01, ***P < 0.001, and ****P < 0.0001. (C) PIG anchor biosynthesis pathway. Genes highlighted in red represent genes that show long sleep phenotypes when knocked down pan-neuronally in Drosophila as described below, while genes in gray exhibited no or short sleep phenotype. Genes in black were untested because there were no available RNAi lines.