
Fig. 6
- ID
- ZDB-IMAGE-230605-61
- Publication
- Luderman et al., 2022 - Zebrafish Erc1b mediates motor innervation and organization of craniofacial muscles in control of jaw movement
- All Figures
- Figures for Luderman et al., 2022
|
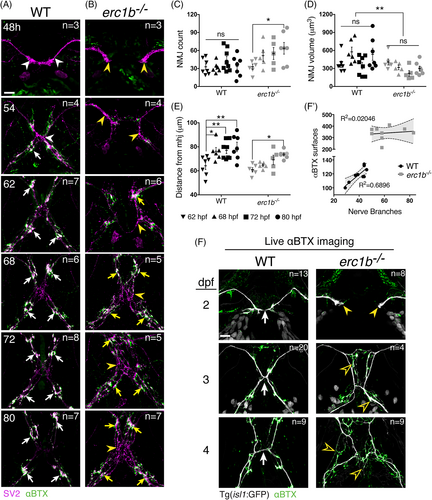
Fig. 6 NMJs in Erc1b deficient zebrafish fail to organize during development. A, Sequential NMJ staining of fixed tissue (SV2, magenta; αBTX, green) in WT embryos (timepoints indicated in upper left corner), and B, erc1b−/− embryos. Arrowheads indicate SV2 staining throughout the cranial nerves, and arrows indicate coalescence of SV2/αBTX staining. C-E, Quantification of 3D NMJ renderings in 62-80 hpf animals. Symbols indicate individual animals, lines indicate mean with SEM. Two-way ANOVA with Sidak's multiple comparison was used for statistical significance, **P < .01, *P < .05. F, Representative images of live WT (left) and erc1b−/−/Tg(isl1:GFP) larvae (right) following αBTX incubation. White arrows indicate nerve midline in WT. Yellow arrowheads indicate trigeminal nerve growth tips, and open yellow arrowheads indicate ectopic nerve branching in erc1b−/− larvae. F′, Linear regression of nerve branches and αBTX surfaces in 4 dpf larvae (WT n = 9, erc1b−/− n = 9). Symbols indicate individual animals, with best fit line, R2 values and 95% confidence interval (shaded area). All images are maximum intensity projections, ventral views with anterior on top. Number of examined animals (n) listed in top right of each image. Scale bars = 25 μm