IMAGE

Fig. 2

ID
ZDB-IMAGE-230605-23
Source
Figures for Bhavna et al., 2023
Image
Figure Caption

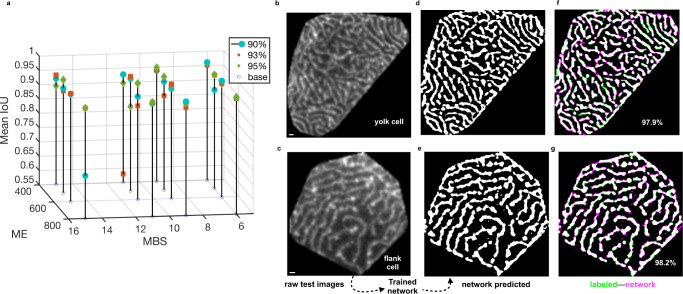
Fig. 2 Trained network selection based on predicted accuracy versus network hyperparameters and visual inspection of pixel-wise segmentation.

a 3D stem plot shows how the mini-batch size (MBS) and maximum epoch (ME) affect the network performance, measured by the mean IOU. For each proportion of the training set, the MBS and ME values were varied as (6, 9, 11, and 15) and (400, 500, 600, and 800) to yield 16 combinations of these hyperparameters. Typically, better accuracy is achievable for smaller MBS and a larger ME, for which our tested combinations of hyperparameters showed performances above ~90% mean IOU. b, c An exemplary single yolk and flank pattern (1 pixel is 0.098 μm and 0.08 μm), respectively, fed to the selected trained network. d, e Trained network-segmented outputs for MBS = 6 and ME = 800 using the 93% training dataset (1397 randomly chosen microridge patterns). f, g Pixel-wise overlap between images labeled using the conventional microridge segmentation pipeline and network-segmented images, shown in green pixels and magenta pixels, respectively; common regions in white (microridges) or black (background). The performance measure is given by mean IOU for each cell pattern.

Acknowledgments
This image is the copyrighted work of the attributed author or publisher, and ZFIN has permission only to display this image to its users. Additional permissions should be obtained from the applicable author or publisher of the image. Full text @ NPJ Syst Biol Appl