IMAGE

Fig. 3

ID
ZDB-IMAGE-230605-15
Source
Figures for Du et al., 2023
Image
Figure Caption

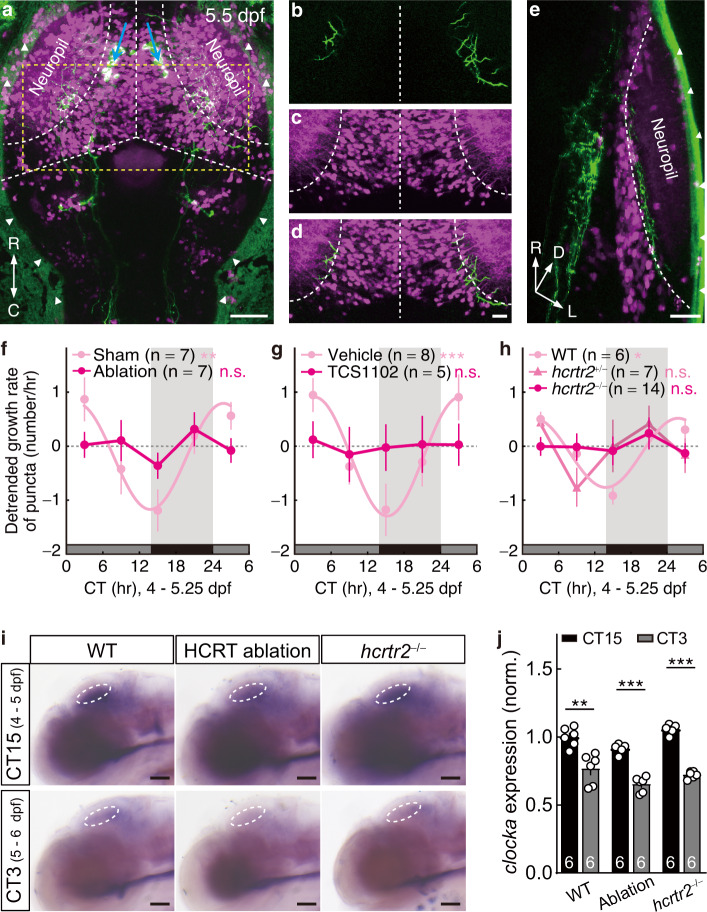
Fig. 3 Hypocretinergic system is required for the circadian rhythm of synaptogenic rate.

ae Confocal images of the dorsal projection view (a), a cropped and partial (6-μm thick) projection view (bd), and the rotated (60° along y-axis) lateral 3-D projection view (e) of a 5.5-dpf Tg(−2.0Tru.Hcrt:EGFP)zf11;Mü4023 larva showing the location of HCRT neuron somas (a, blue arrows) and their axon projections (green, be). The Mü4023 labels some tectal neurons (TNs) in OT (magenta). Arrowheads, nonspecific fluorescent signals on the skin; white dotted line, borders of the OT and the boundaries between the neuropil and soma layer of the OT or between the two tectal hemispheres; yellow dotted line, the cropped area for (bd). Three independent experiments were repeated. fh Detrended growth rate of Sypb-EGFP puncta imaged during 4–5.25 dpf showing that the circadian rhythm of retinotectal synaptogenesis is disrupted by bilateral HCRT neuron ablation (f), HcrtR antagonist TCS1102 treatment (g), and hcrtr2 mutation (h). Larvae entrained with normal LD cycles during 0–4 dpf were then reared under DD. i Lateral view of whole mount in situ hybridization showing unaffected rhythmic clocka expression under DD conditions after 4-day LD entrainment in the OT of larvae with bilateral HCRT neuron ablation or hcrtr2 mutation. j Quantification of the clocka mRNA expression in OT at the two circadian time points shown in (i). For each individual, the mean signal intensity in the circled tectal area (white circle in i) was normalized to the mean value of the WT group at CT15. The numbers on the bars indicate the numbers of larvae examined. Scale bars, 50 μm (a, i), 20 μm (be). n.s., not significant; **P = 0.002 in (f), ***P = 8.0 × 10−4 in (g), *P = 0.01 in (h); **P = 0.001, ***PAblation = 2.0 × 10−6 and ***Phcrtr2-/- < 1.0 × 10−6 in (j) (one-tailed Fisher’s g-test for (fh), nonparametric two-tailed multi t-test with Holm-Sidak method for multiple comparisons correction for j). C caudal, D dorsal, L lateral, M medial, R rostral, CT circadian time. Error bars denotes s.e.m.. Source data are provided as a Source Data file.

Acknowledgments
This image is the copyrighted work of the attributed author or publisher, and ZFIN has permission only to display this image to its users. Additional permissions should be obtained from the applicable author or publisher of the image. Full text @ Nat. Commun.