
|
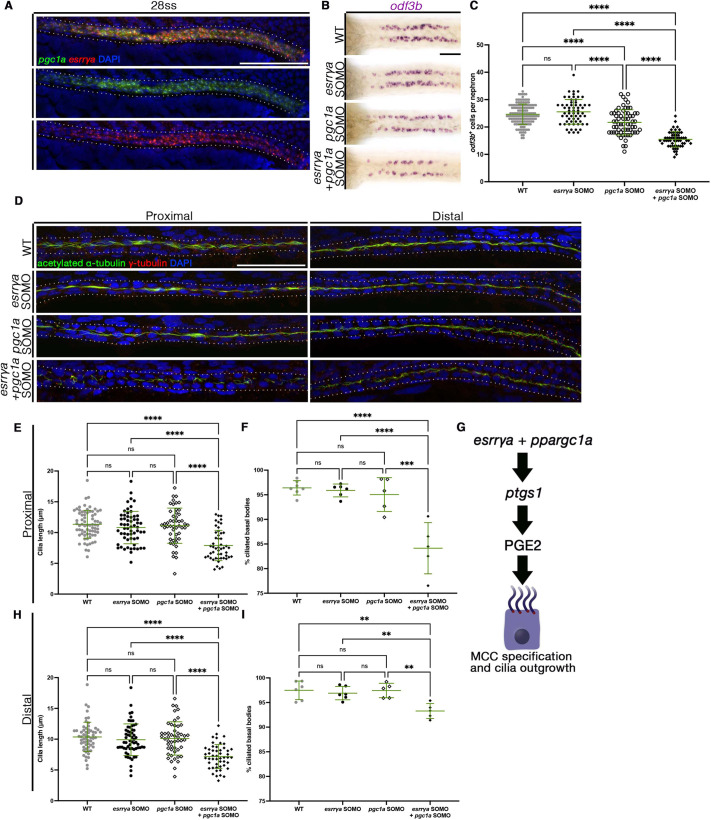
Fig. 4.
Genetic interaction of esrrγa and pgc1a drives MCC specification and ciliogenesis. (A) FISH reveals that esrrγa colocalizes with pgc1a in 24 hpf WT zebrafish. (B) MCCs stained via WISH (odf3b). (C) MCCs per nephron. Each dot represents one nephron. Two nephrons were measured per animal. (D) IF for indicated markers at 28 hpf. Dotted lines indicate nephron tubule. (E,H) Cilia length in proximal (E) and distal (H) pronephros. Each dot represents one cilium. Ten cilia were measured per animal. WT n=6, esrrγa SOMO n=6, pgc1a SOMO n=5, esrrγa and pgc1a SOMO n=5. (F,I) Percentage of ciliated basal bodies in proximal (F) and distal (I) pronephros. Each dot represents an individual. (G) esrrγa and pgc1a cooperate upstream of ptgs1 and PGE2 production to regulate MCC cell fate and ciliogenesis. Data are mean±s.d. **P<0.01, ****P<0.0001 (one-way ANOVA). ns, not significant. Scale bars: 50 µm.