
Image
|
Figure Caption
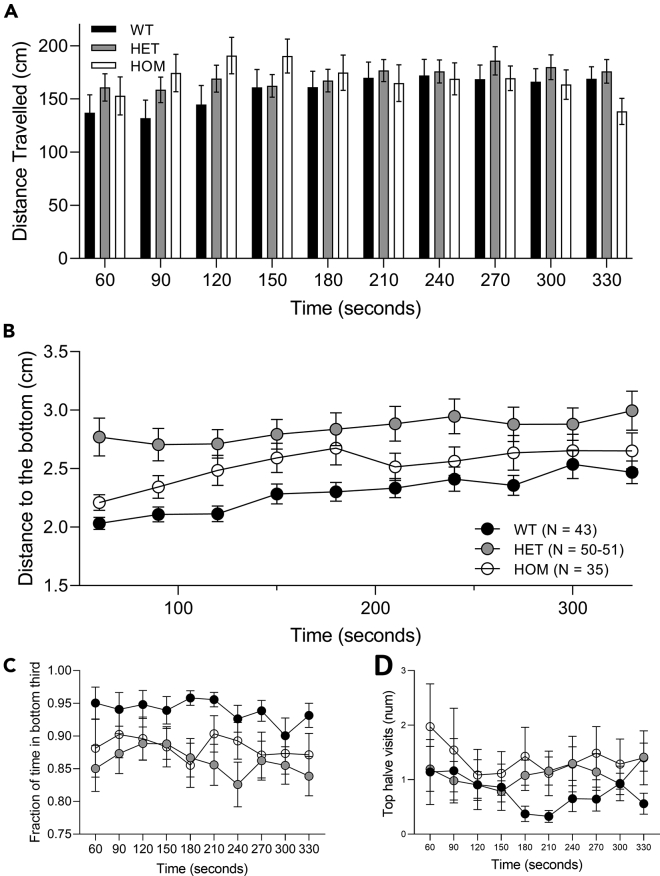
Fig. 5
Novel tank diving assay shows anxiolytic phenotype in baz1b LoF zebrafish
(A) Changes in distance traveled for the three genotypes in the novel tank diving assay divided in 30 s time beams.
(B) Distance to the bottom of the assay in each 30 s for the three genotypes.
(C) Fraction of time in the bottom third and D) top half visits for the three genotypes during the novel tank diving assay. Graphs show mean ± SEM. Intragroup variations in N number are due to statistical exclusion criteria applied at each time bin.
Acknowledgments
This image is the copyrighted work of the attributed author or publisher, and
ZFIN has permission only to display this image to its users.
Additional permissions should be obtained from the applicable author or publisher of the image.
Full text @ iScience