
|
Fig. 4
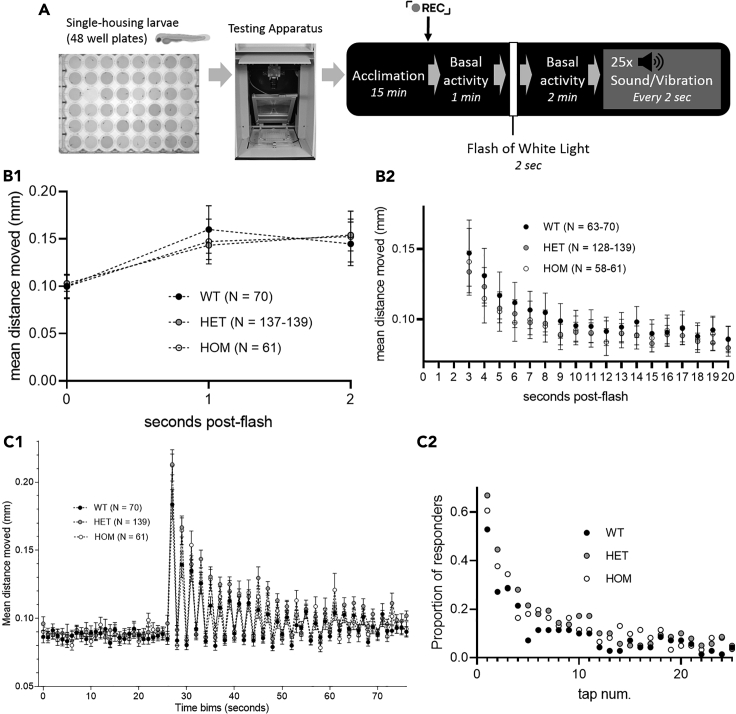
Loss of baz1b diminishes stress response and habituation in the flash of light and acoustic startle assay
(A) Diagram of the assay.
(B) Flash of light: total distance moved during the flash of light (time 0) and 2 s after. Dots represent distance traveled in 1 s time bins (B1), and mean distance moved during recovery for the 18 s following this period (B2). Dots represent 1 s time bins.
(C) Acoustic startle assay: total distance moved 25 s before and during the acoustic cues (C1) and proportion of responders during the acoustic cues (C2). In all cases, data show mean ± SEM. Intragroup variations in N number are due to statistical exclusion criteria applied at each time bin.