
Image
|
Figure Caption
Fig. 3
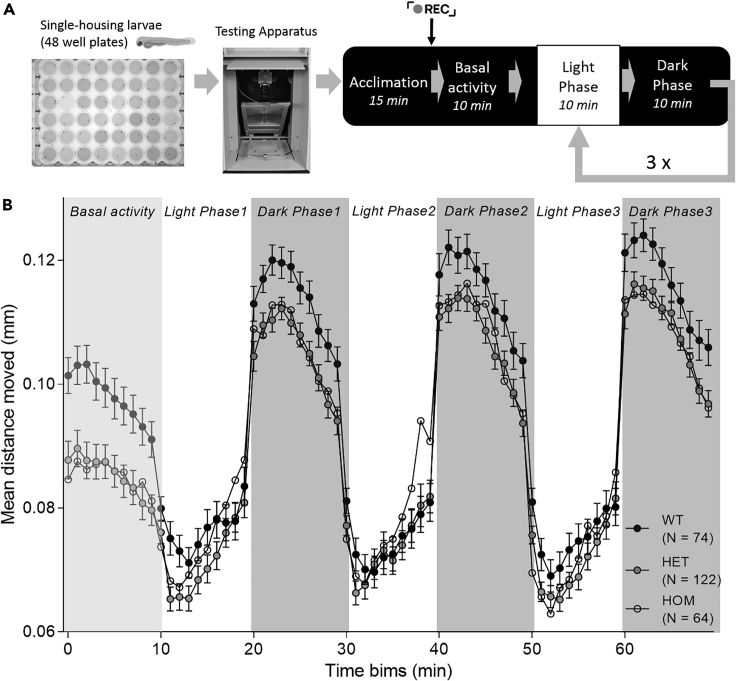
Loss of baz1b leads to faster habituation in the forced light-dark transition (FLDT) assay
(A) Diagram of the assay.
(B) Mean distance moved per genotype during the baseline and the three light-dark cycles (10 min each). Note that both HET and HOM describe a steeper slope than WT sibling during the light phases. Data show mean ± SEM.
Figure Data
Acknowledgments
This image is the copyrighted work of the attributed author or publisher, and
ZFIN has permission only to display this image to its users.
Additional permissions should be obtained from the applicable author or publisher of the image.
Full text @ iScience