
|
Fig. 2
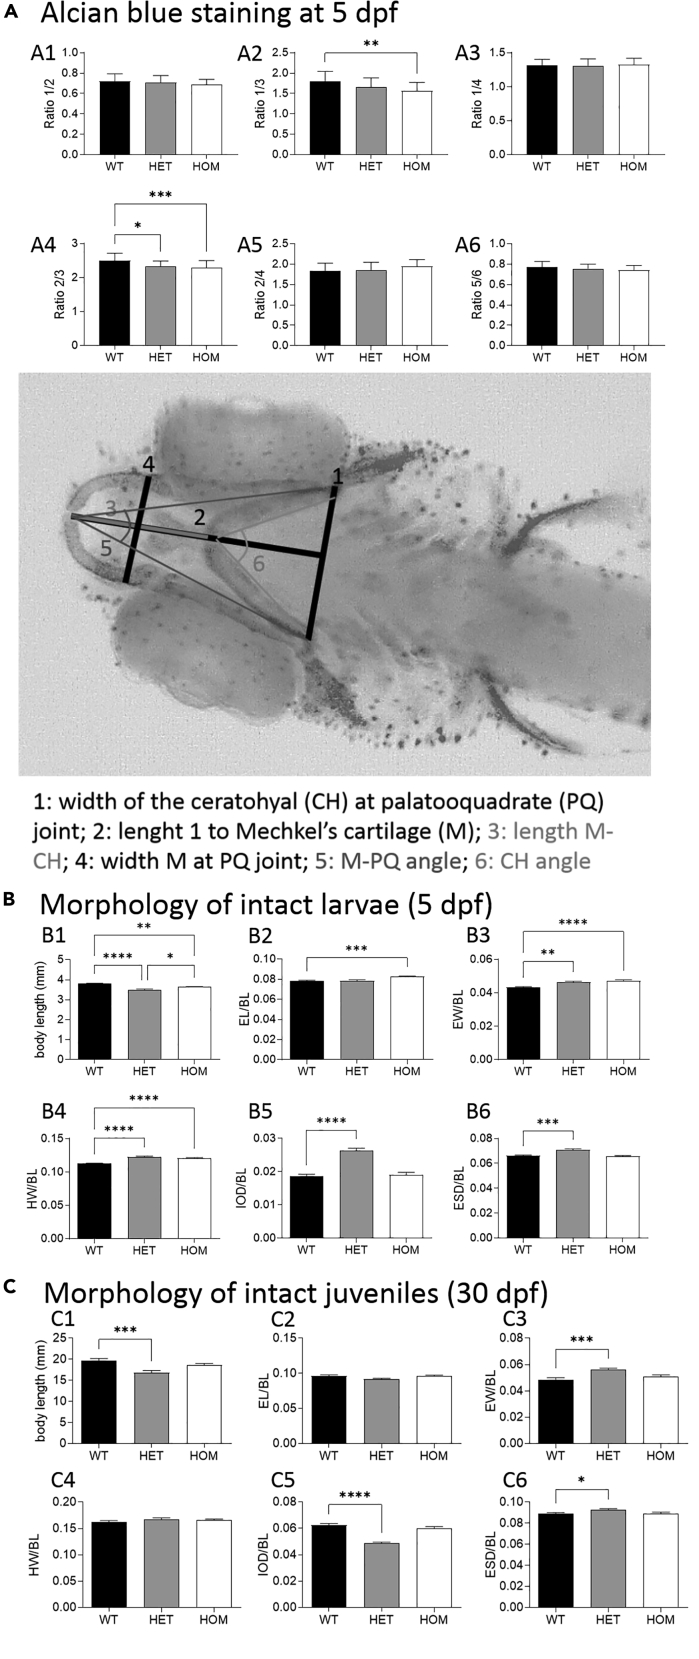
baz1b LoF zebrafish have altered craniofacial features
(A) Comparison between genotypes for the cranial features (outlined in the picture below) observed at 5 dpf by Alcian blue staining: ratio 1/2 (A1), ratio 1/3 (A2), ratio 1/4 (A3), ratio 2/3 (A4), ratio 2/4 (A5), and ratio 5/6 (A6).
(B) Morphological comparisons of intact 5 dpf for the three genotypes: body length (BL, in mm; B1), eye length (EL) normalized to BL (B2), eye width (EW) normalized to BL (B3), head width (HW) normalized to BL (B4), inter-ocular distance (IOD) normalized to BL (B5), and eye-snout distance (ESD) normalized to BL (B6).
(C) Morphological comparison of intact juvenile fish (30 dpf). Graphs show mean ± SEM. In all cases: ∗p < 0.05; ∗∗p < 0.01; ∗∗∗p = 0.001; ∗∗∗∗p < 0.001. Statistical test: one-way ANOVA with Tukey correction for multiple comparison for A1, A3, A5, A6, B2–B6, and C1–C6; non-parametric test of Kruskal-Wallis corrected for multiple comparison for A2, A4, and B1.