
Image
|
Figure Caption
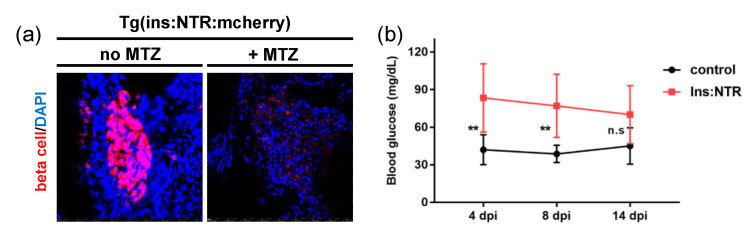
Figure 2
β-cell ablation and regeneration. (a) Fluorescence images of the control zebrafish beta cells compared with MTZ-treated zebrafish β-cells. (b) Blood glucose levels in the control and MTZ-treated zebrafish. β-cell ablation results that return to control levels by MTZ + 14 days. Significance levels are ** p < 0.003, and n.s p > 0.05.
Acknowledgments
This image is the copyrighted work of the attributed author or publisher, and
ZFIN has permission only to display this image to its users.
Additional permissions should be obtained from the applicable author or publisher of the image.
Full text @ Bioengineering (Basel)