
Image
|
Figure Caption
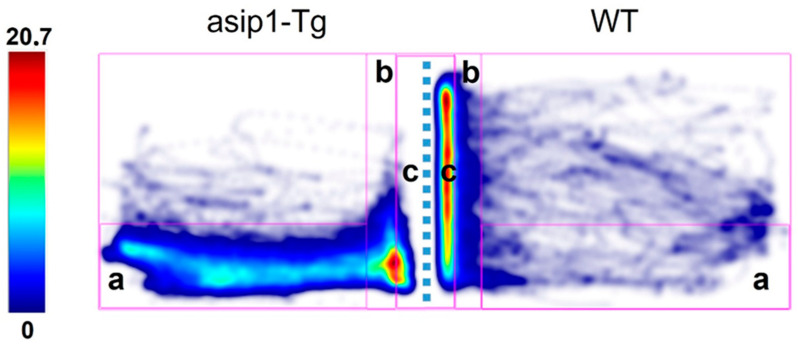
Figure 4
Representative heatmaps of asip1-Tg (left) and WT (right). The colour scale represents the cumulative time spent in each of the previously defined arena zones. (a) a safe area consisting of the bottom part of the tank; (b) near the mirror zone, an exploration area where fish can approach but not touch the mirror; and (c) a close to the mirror area where direct contact of the fish with the mirror can take place. The dotted line represents the position of the mirror.
Acknowledgments
This image is the copyrighted work of the attributed author or publisher, and
ZFIN has permission only to display this image to its users.
Additional permissions should be obtained from the applicable author or publisher of the image.
Full text @ Biology (Basel)