IMAGE

Figure 10

ID
ZDB-IMAGE-230530-31
Source
Figures for Adrião et al., 2023
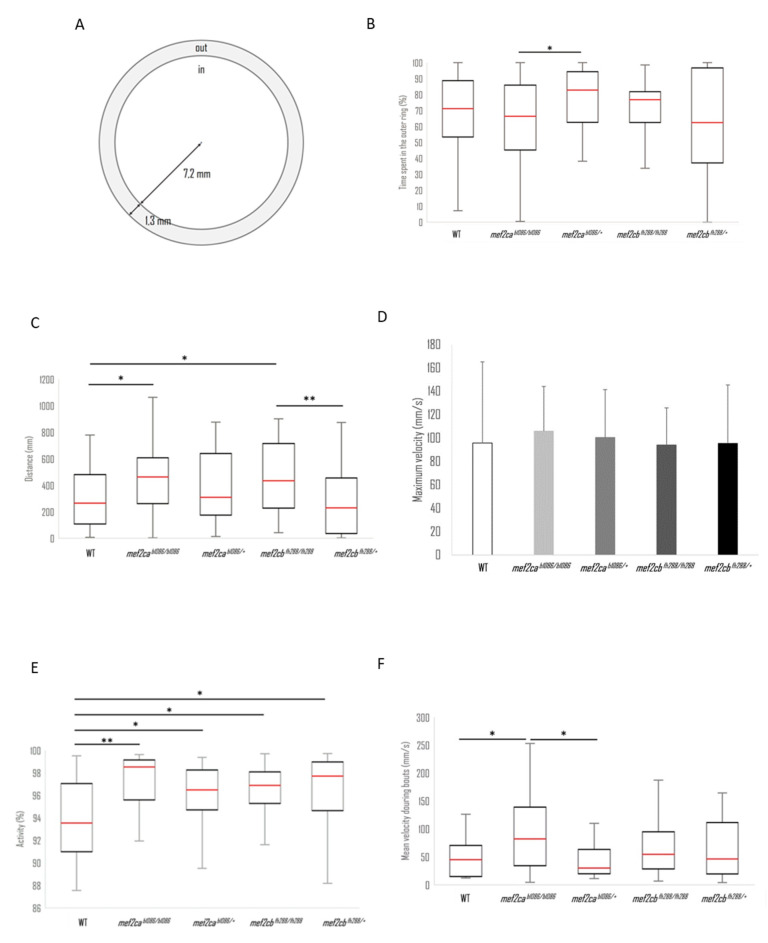
Image
Figure Caption

Figure 10

Analysis of trajectories for wild-type (N = 46), mef2cab1086/b1086 (N = 19), mef2cab1086/+ (N = 46), mef2cbfh288/fh288 (N = 53) and mef2cbfh288/+ (N = 42) larvae. (A) The arena-surface division into inner and outer regions used for data analysis. (B) Time percentage spent in an outside disk. (C) Total distance covered by each individual in a group during the recording time of 3 min. (D) Maximum velocity median of every group during the recording time of 3 min. (E) Mean velocity during movement bouts. (F) Median percentage of time in activity. Significant statistical differences are indicated by * for p < 0.05 and ** for p < 0.01.

Acknowledgments
This image is the copyrighted work of the attributed author or publisher, and ZFIN has permission only to display this image to its users. Additional permissions should be obtained from the applicable author or publisher of the image. Full text @ Biomolecules