
Image
|
Figure Caption
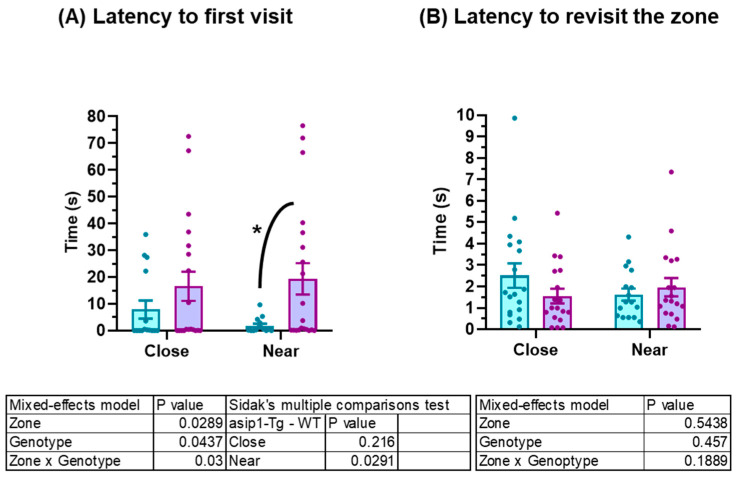
Figure 2
Behavioural differences between asip1-Tg and WT in the mirror–image stimulus test. (A) Latency to both first approximation (close area) and exploration (near area); (B) Latency to repeat approximation and exploration behaviours. Experiments were performed on 20 WT and 20 asip1-Tg fish. Data are represented as mean ± SEM and analysed by two-way ANOVA repeated measures (RM), followed by Sidak’s multiple comparison test. Blue and purple colours represent asip1-Tg and WT fish, respectively. Asterisks indicate statistical differences between genotypes (p ≤ 0.05).
Acknowledgments
This image is the copyrighted work of the attributed author or publisher, and
ZFIN has permission only to display this image to its users.
Additional permissions should be obtained from the applicable author or publisher of the image.
Full text @ Biology (Basel)