
|
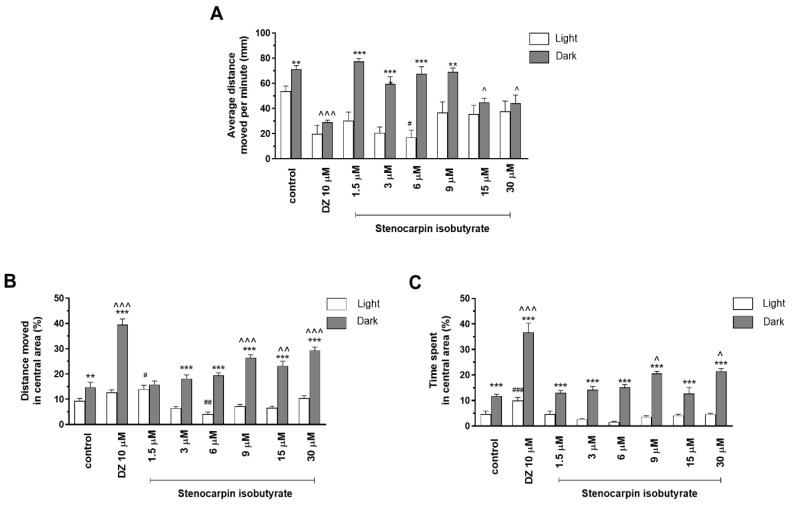
Figure 3
The effects of stenocarpin isobutyrate (1.5, 3, 6, 9, 15, and 30 µM) and diazepam (DZ, 10 µM) on locomotor activity during all three light–dark challenge phases. (A) Average distance moved by zebrafish larvae within each 1 min time bin under either light (open bars) or dark (filled bars). (B) The percentage of distance moved by zebrafish larvae in the central area during the light phase (white bars) or dark phase (filled bars). (C) The percentage of time spent by zebrafish larvae in the central area during the light phase (white bars) or dark phase (filled bars). Data are presented as mean ± SEM; n = 32. ** p < 0.01, *** p < 0.001 in comparison to light conditions within the same concentration group; ^ p < 0.05, ^^ p < 0.01, ^^^ p < 0.001 in comparison to control group under dark condition; # p < 0.05, ## p < 0.01, ### p < 0.001 in comparison to control group under light condition (post hoc Bonferroni’s test).