
Image
|
Figure Caption
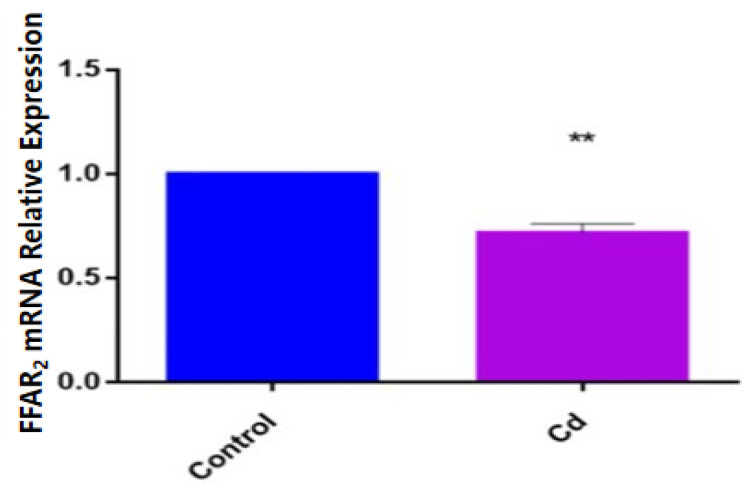
Figure 4
Relative expression of FFAR2 mRNA in zebrafish in the Cd group and control group. Note: ** means significance at p < 0.01.
Figure Data
Acknowledgments
This image is the copyrighted work of the attributed author or publisher, and
ZFIN has permission only to display this image to its users.
Additional permissions should be obtained from the applicable author or publisher of the image.
Full text @ Metabolites