
Image
|
Figure Caption
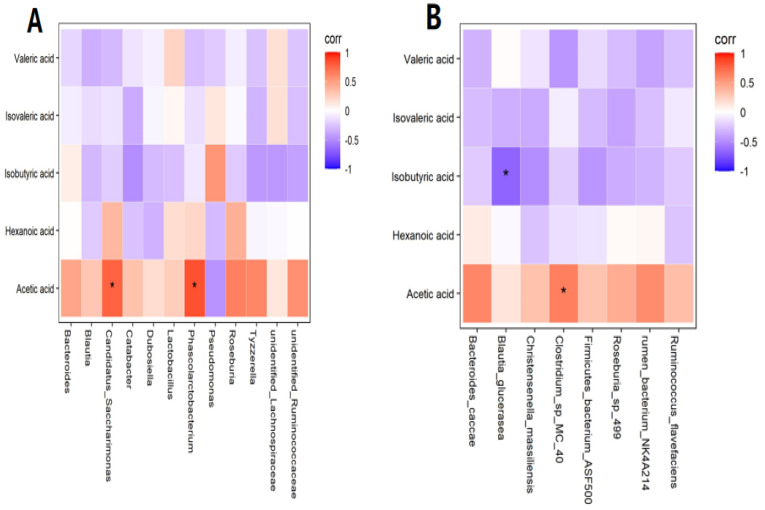
Figure 3
(A) Correlation analysis with short−chain fatty acids (SCFAs) at the genus level. (B) Correlation analysis with SCFAs at the species level. Note: * means significance at p < 0.05.
Figure Data
Acknowledgments
This image is the copyrighted work of the attributed author or publisher, and
ZFIN has permission only to display this image to its users.
Additional permissions should be obtained from the applicable author or publisher of the image.
Full text @ Metabolites