
Figure 9
- ID
- ZDB-IMAGE-230523-60
- Publication
- Oprişoreanu et al., 2023 - Drug screening in zebrafish larvae reveals inflammation-related modulators of secondary damage after spinal cord injury in mice
- All Figures
- Figures for Oprişoreanu et al., 2023
|
Figure 9
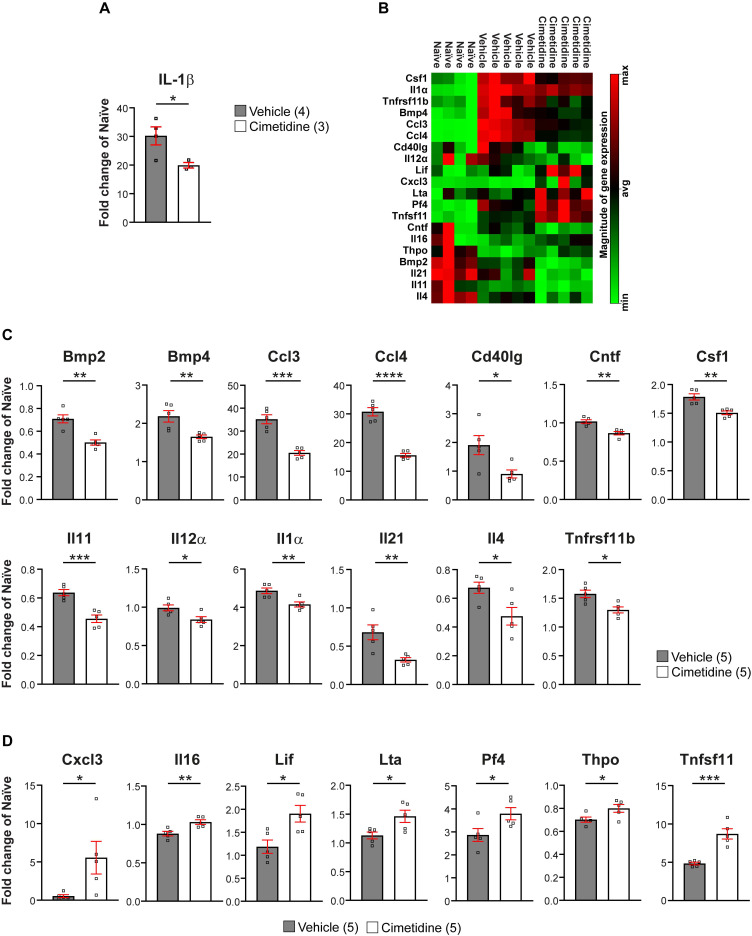
Cimetidine changes the cytokine profile of the injury site in mice. A: qRT-PCR shows significant decrease in il-1β mRNA expression after 1 day of Cimetidine treatment (one-way ANOVA with Tukey's multiple comparison test, p**** < 0.0001, vehicle vs. cimetidine p* = 0.0219). B: Results of the RT2 profiler cytokine array (PAMM-150Z) after 10 days of Cimetidine treatment depicted as a heat map indicating genes with decreased (green) and increased (red) transcript levels (quantification shown in C and D) in individual mice in the three indicated groups is shown. C: Quantification of genes with decreased transcript levels is shown for B. D: Quantification of genes with increased transcript levels is shown for B. Statistics for C,D: vehicle vs. cimetidine: two-tailed Mann Whitney U-test for all comparisons; Bmp2: p** = 0.0012; Bmp4: p** = 0.009; Ccl3: p*** = 0.0002; Ccl4: p**** ≤ 0.0001; Cd40lg: p* = 0.0238; Cntf: p** = 0.0013; Csf1: p** = 0.0023; Il11: p*** = 0.0007; Il12α: p* = 0.0219; Il1α: p** = 0.0069; Il21: p** = 0.0073; Il4: p* = 0.0257; Tnfrsf11b: p* = 0.0104; Cxcl3: p* = 0.0469; Il16: p** = 0.0065; Lif: p* = 0.0148; Lta: p* = 0.0264; Pf4: p* = 0.0418; Thpo: p* = 0.0425; Tnfsf11: p*** = 0.0005; n = 4-5 mice per group.