
|
Figure 6
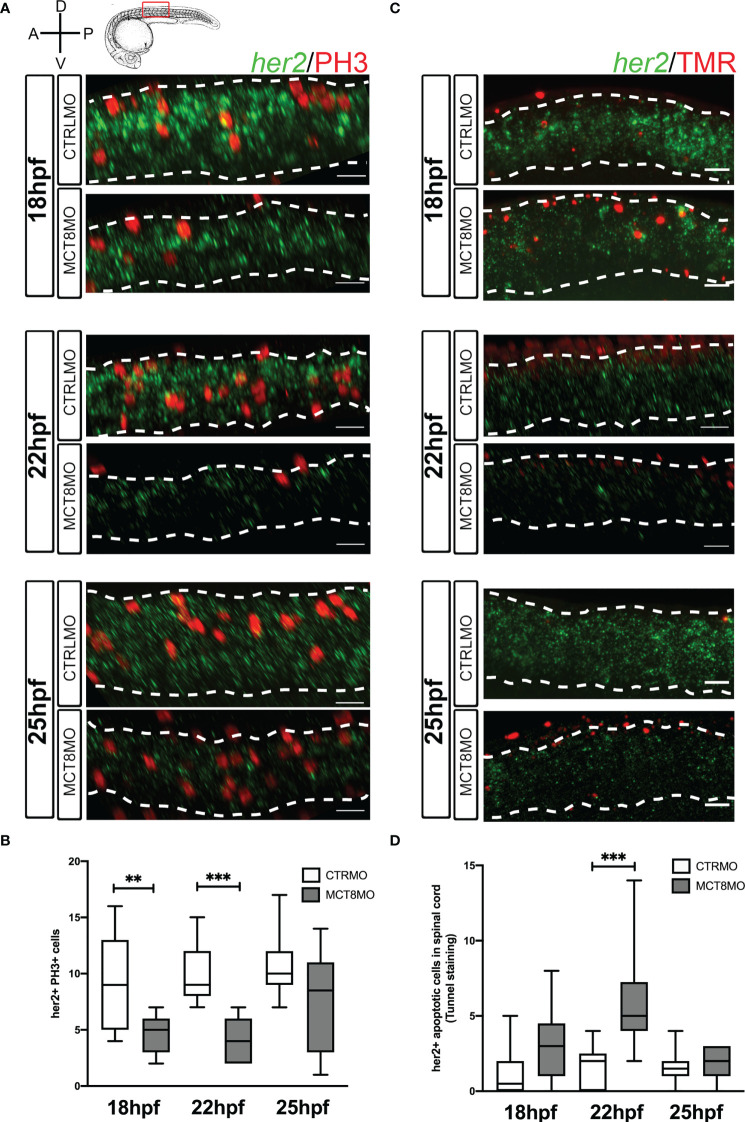
Impaired MTH signaling decreases her2+ neural progenitor cells undergoing mitosis in the spinal cord. (A) Analysis of her2 expression by fluorescent in situ hybridization (green) and mitotic cells (phosphohistone 3 antibody; red) in CTRLMO) and MCT8MO embryos. (B) Box-and-whiskers plot depicting quantification of the number of her2+ mitotic cells (her2+/PH3+) in the spinal cord at 18, 22, and 25hpf. (C) Analysis of her2 expression by fluorescent in situ hybridization (green) and colocalization with apoptotic cell detected using a TUNEL assay (red). (D) Box-and-whiskers plot depicting the quantification of the number of her2+ apoptotic cells in the spinal cord. The images represent a lateral view of the spinal cord between somite 8-12; rostral is to the left in all images; the scale bar represents 50 µm. Colocalization was quantified in the volume of 2 myotomes within this spinal cord region. n=10-15. Statistical significance determined by t-test: two-sample, assuming equal variances. **p<0.01; *** p<0.001.