
Image
|
Figure Caption
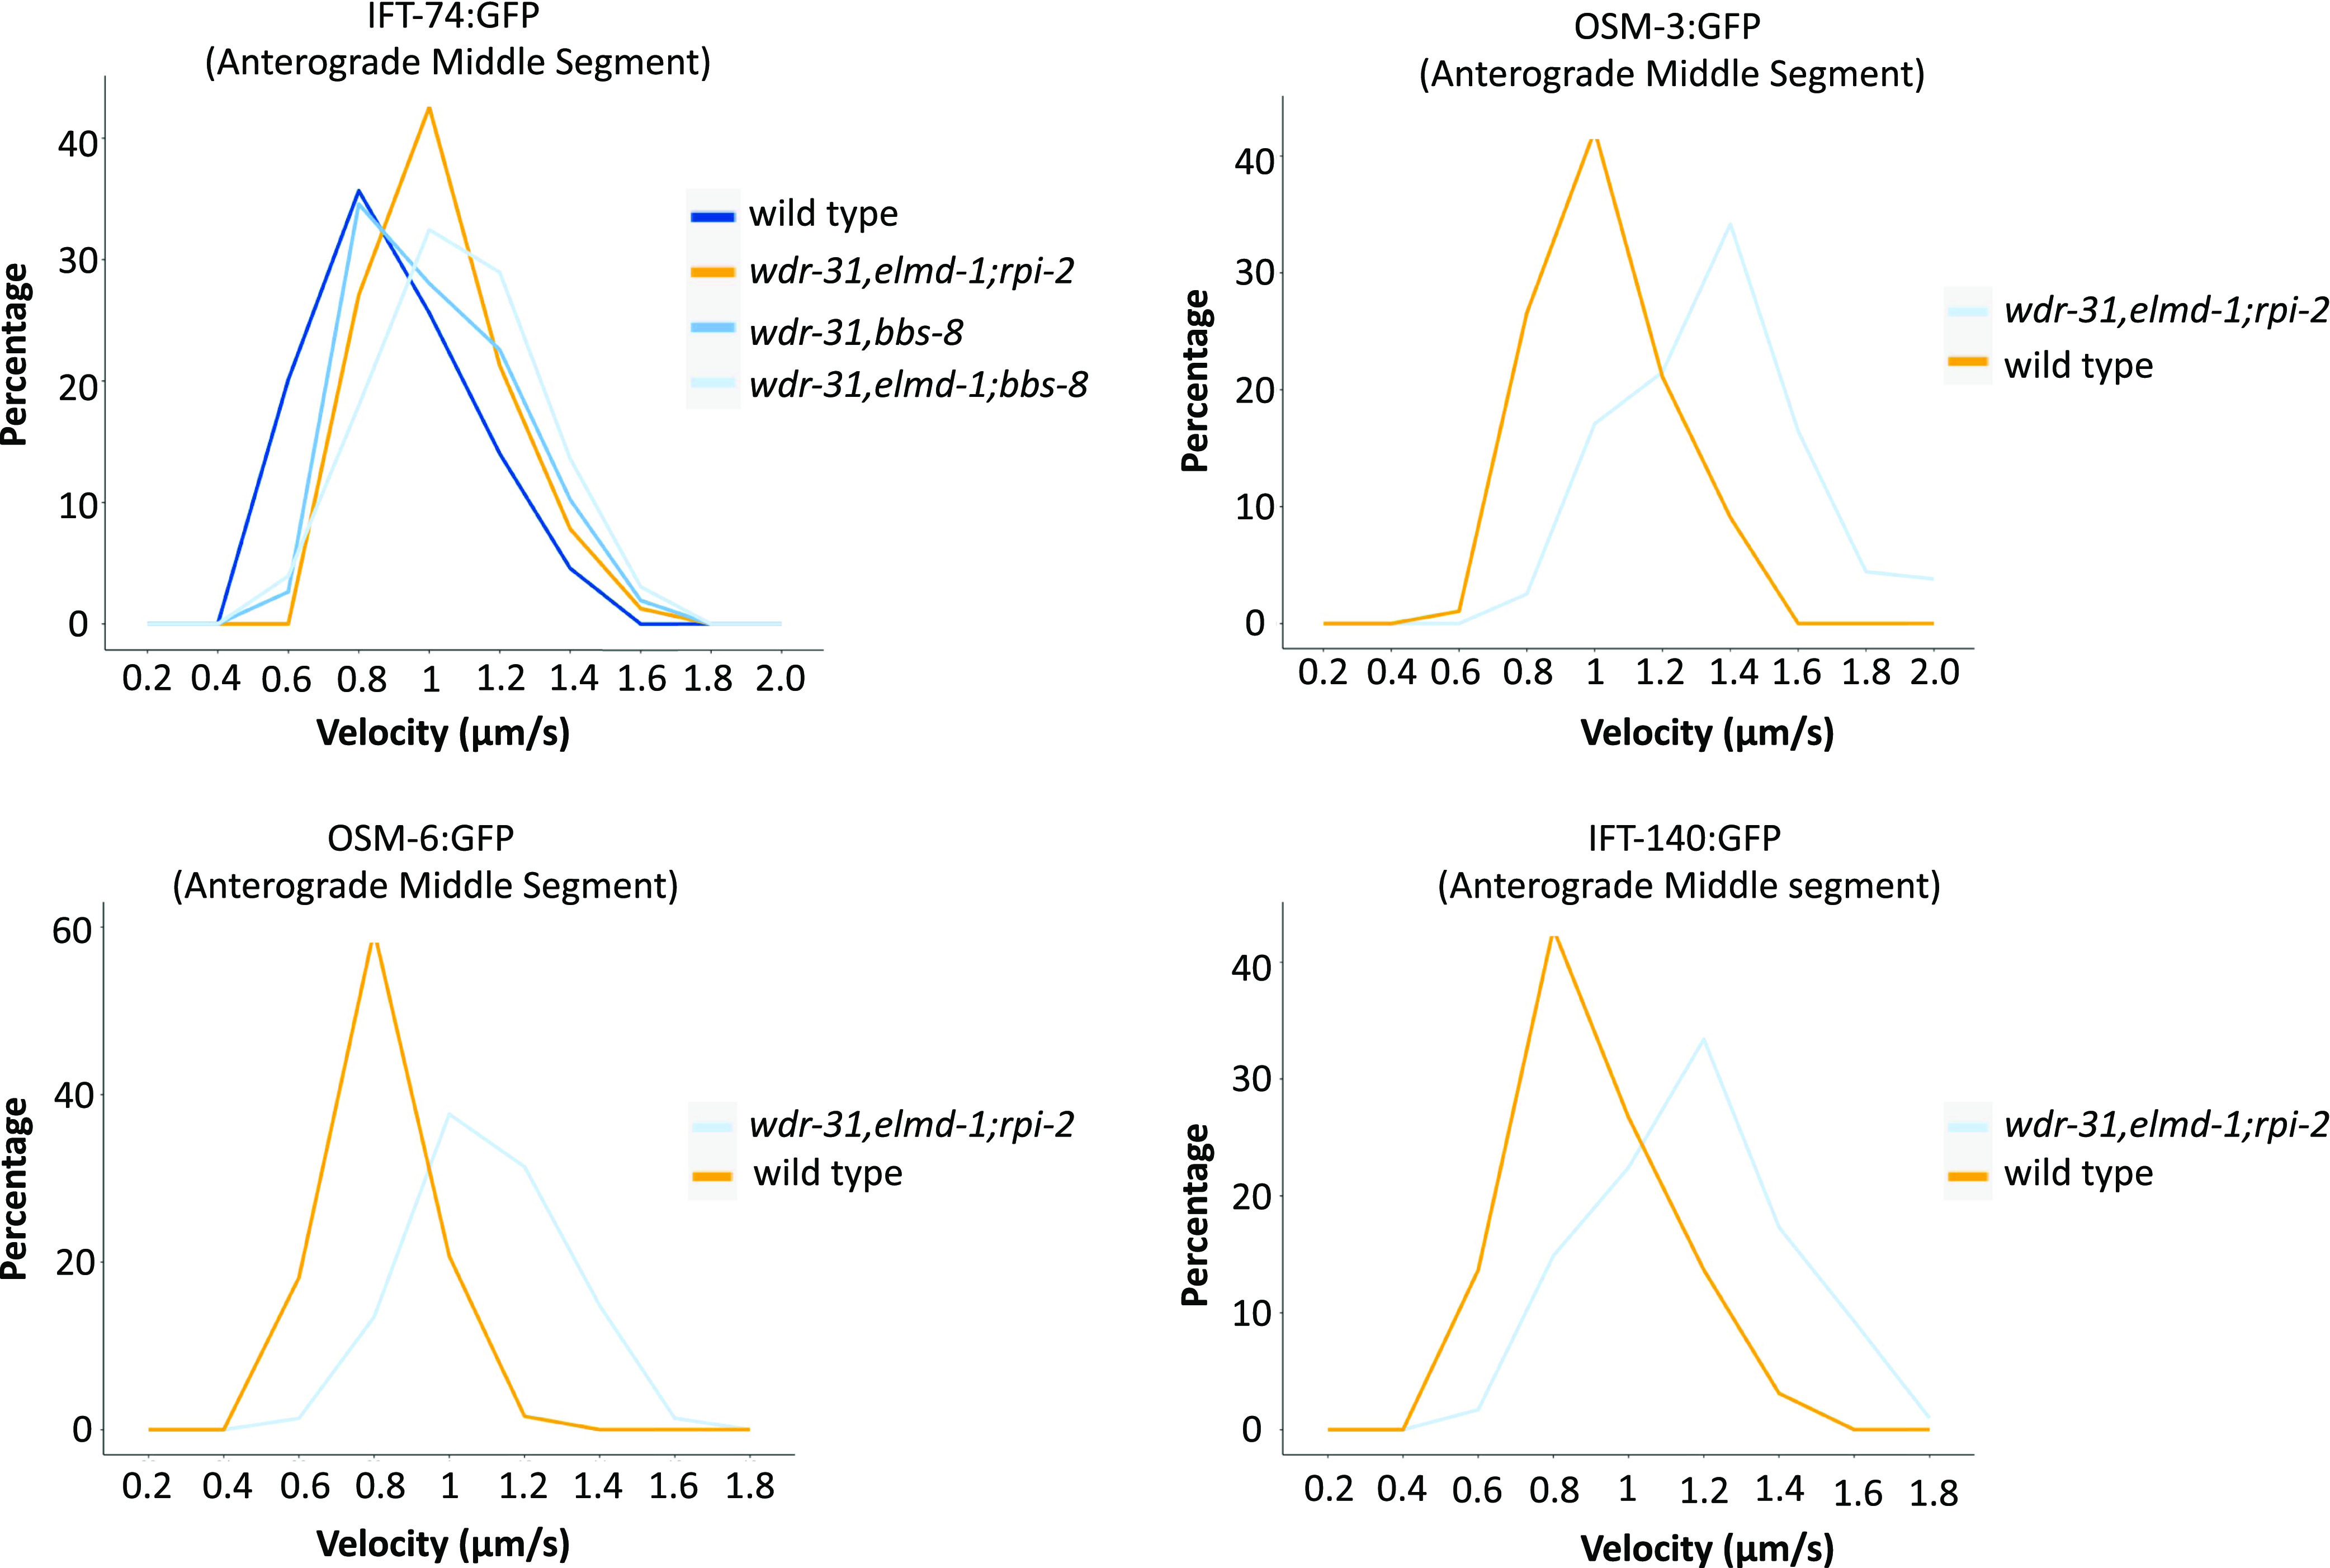
Figure 8.
The percentage distribution (particles) of the indicated IFT velocities (anterograde middle segment) in the WT and corresponding mutants is shown in the velocity versus percentage line graphs. The complete list of proteins that interact with WDR31 and ELMOD3 is provided in Table S2.
Acknowledgments
This image is the copyrighted work of the attributed author or publisher, and
ZFIN has permission only to display this image to its users.
Additional permissions should be obtained from the applicable author or publisher of the image.
Full text @ Life Sci Alliance