
Image
|
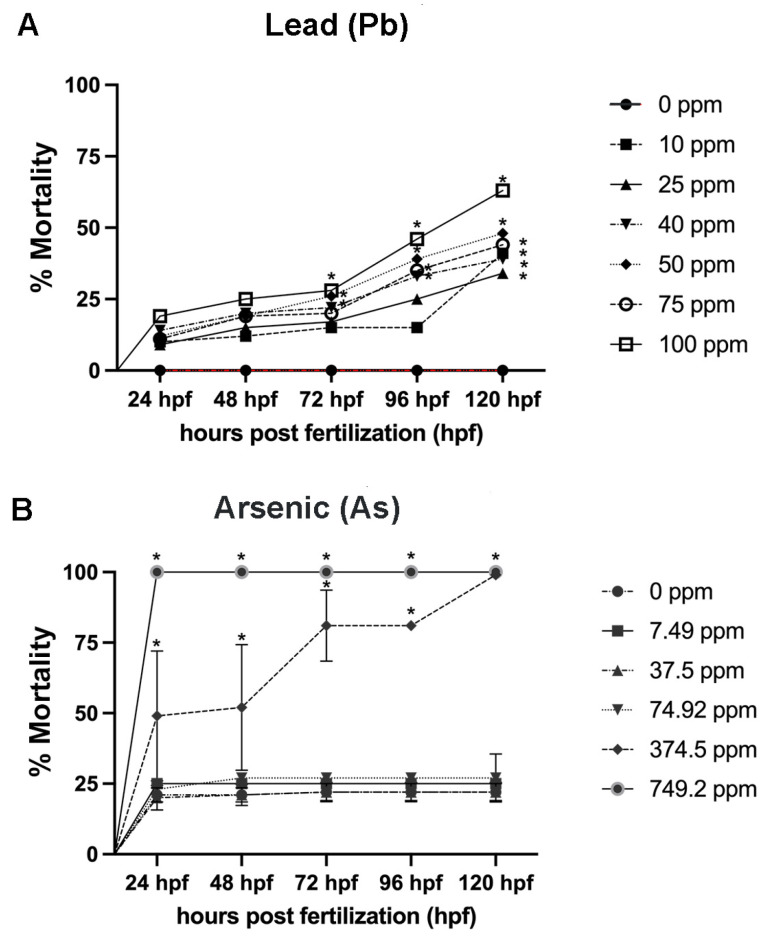
Figure Caption
Fig. 2
Percent mortality assessed every 24 h from 1–120 h post fertilization (hpf) for Pb and As. Single chemical exposures for Pb (A) and As (B). N = 4 biological replicates for each treatment group with 50 subsamples per each treatment group. Data is presented as mean ± standard deviation. * p < 0.05.
Acknowledgments
This image is the copyrighted work of the attributed author or publisher, and
ZFIN has permission only to display this image to its users.
Additional permissions should be obtained from the applicable author or publisher of the image.
Full text @ Biomolecules