
Fig. S1
- ID
- ZDB-IMAGE-230522-54
- Publication
- Yang et al., 2022 - A brainstem integrator for self-location memory and positional homeostasis in zebrafish
- All Figures
- Figures for Yang et al., 2022
|
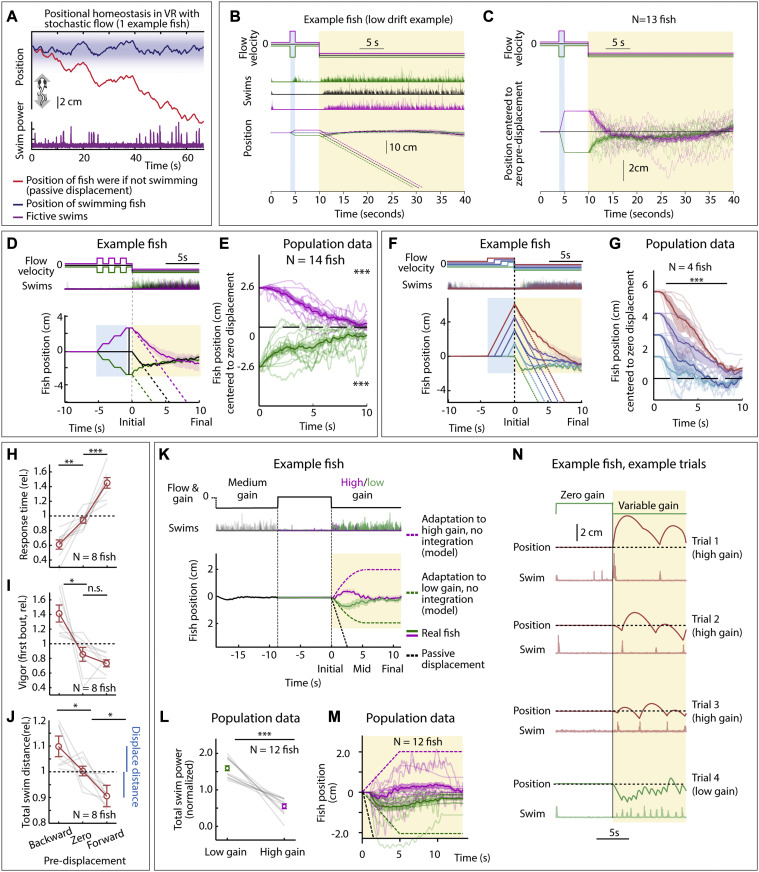
Fig. S1 Positional homeostasis, extended characterization, related to Figure 1
(A) Positional homeostasis example, in which an example fish approximately stabilizes its location in a stochastic virtual water current.
(B) Positional homeostasis assay with a 30-s swim period in an example fish.
(C) Centered trajectories for N = 13 fish showing persistent convergence.
(D) Triple forward pre-displacement/backward pre-displacement assay. Example fish, showing converging trajectories, indicating successful integration across three consecutive pre-displacements. (Shaded regions: SEM in all panels.)
(E) Population data (14 fish) showing near-complete correction for earlier pre-displacement. (One-sample t test, ∗∗∗p < 0.001, p = 9.7e−10 for forward pre-displacements, p = 1.9e−10 for backward pre-displacement. Error bars: SEM in all panels.)
(F) Assay to test integration over varying durations. An example fish successfully integrates pre-displacement and corrects for it in the swim period.
(G) Population data (4 fish) showing accurate correction, i.e., path integration. (Two-tailed paired t test, ∗∗∗p < 0.001, p = 1.08e−7 for all forward pre-displacements.)
(H) Animals respond faster (slower) after a backward (forward) pre-displacement, consistent with Figure 1F. (Two-tailed paired t test, ∗∗p < 0.01, p = 1.76e−3 for backward pre-displacement, ∗∗∗p < 0.001, p = 3.1e−4 for forward pre-displacement.)
(I) Animals respond more vigorously after a backyard pre-displacement, consistent with Figure 1F. (Two-tailed paired t test, ∗p < 0.05, p = 0.0151 for backward pre-displacement, n.s. p > 0.05, p = 0.115 for forward pre-displacement.)
(J) Total swim distance (normalized) corresponds to the earlier pre-displacement, consistent with Figure 1F. (Two-tailed paired t test, ∗p < 0.05, p = 0.031 for backward pre-displacements, and p = 0.012 for forward pre-displacements.)
(K) After motosensory gain changes (high: ×1.5, low: ×0.5), animals still integrate position. Dashed lines: position of model fish performing gain adaptation (linear adjustment of vigor over 5 s) but no path integration. Solid lines: position of real fish.
(L) Swim vigor during low or high motosensory gain shows gain adaptation. (Two-tailed paired t test, ∗∗∗p < 0.001, p = 1.6e−5.)
(M) Average fish position in low versus high gain trails initially diverges, then converges. Dashed lines: normalization to model fish performing gain adaptation but no path integration.
(N) Example trials during high and low motosensory gain (data from K–M) showing accurate positional homeostasis in both cases.
Reprinted from Cell, 185, Yang, E., Zwart, M.F., James, B., Rubinov, M., Wei, Z., Narayan, S., Vladimirov, N., Mensh, B.D., Fitzgerald, J.E., Ahrens, M.B., A brainstem integrator for self-location memory and positional homeostasis in zebrafish, 50115027.e205011-5027.e20, Copyright (2022) with permission from Elsevier. Full text @ Cell