
Image
|
Figure Caption
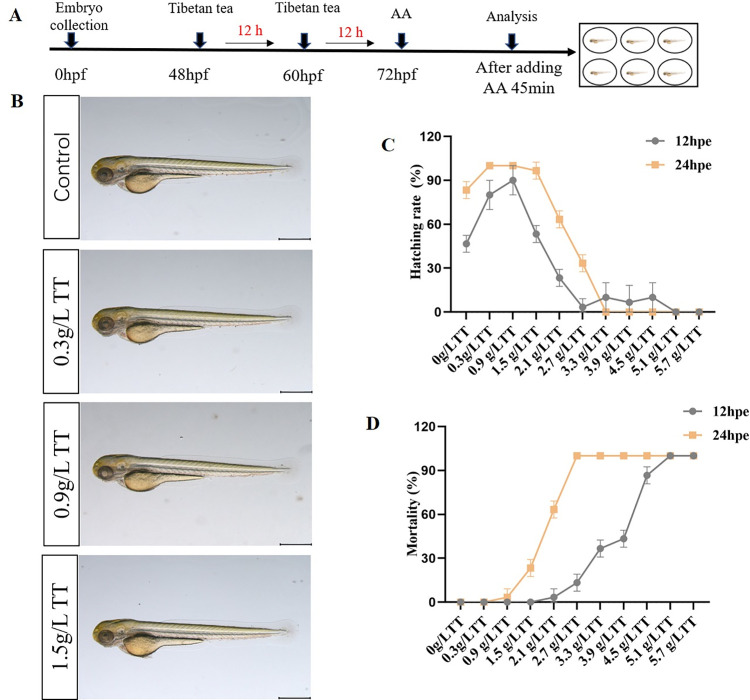
Fig 2 Screening of optimal treatment concentration of Tibetan tea.
Illustration of the timeline of drug protection and AA treatment. (B) Phenotype diagram of the effect of different concentrations of TT on zebrafish. (C) Effects of different TT concentrations on the hatching rate of zebrafish. (D) Effects of Different TT Concentrations on Zebrafish Mortality. (Note: The length of the scale bar in the figure is 500 μm).
Acknowledgments
This image is the copyrighted work of the attributed author or publisher, and
ZFIN has permission only to display this image to its users.
Additional permissions should be obtained from the applicable author or publisher of the image.
Full text @ PLoS One