
|
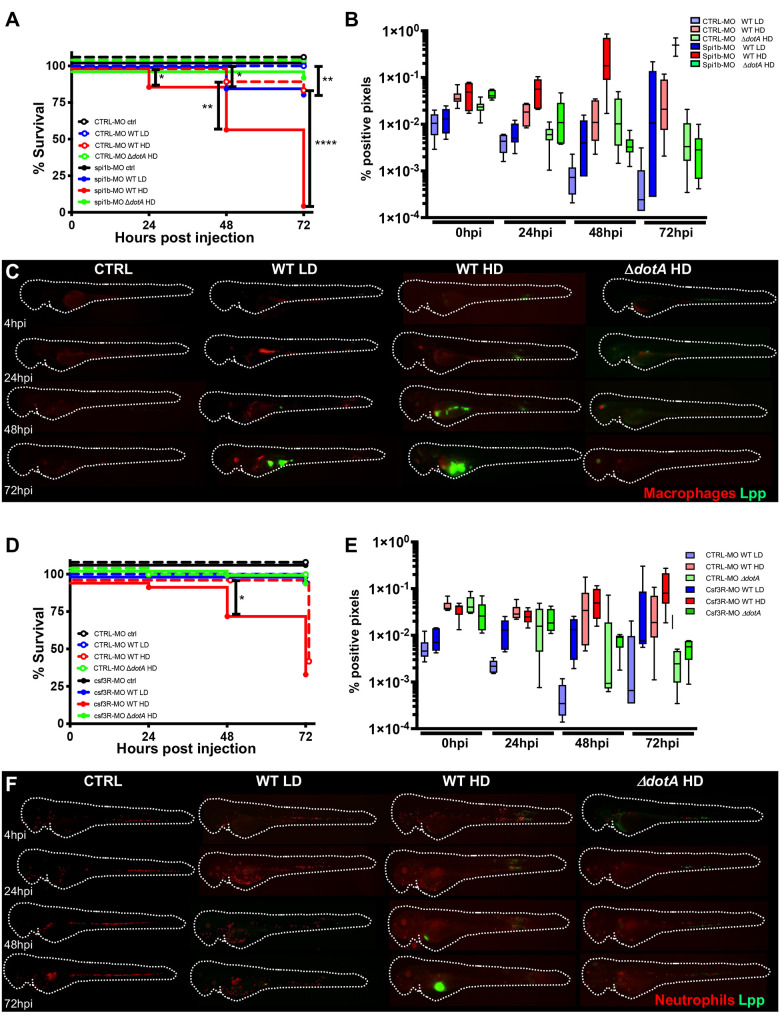
Fig 6
A) Survival curves of CTRL morphant zebrafish larvae injected with a Low Dose (LD) (blue dashed curve, n = 34 larvae) or a High Dose (HD) (red dashed curve, n = 34) of WT-GFP, or with a HD (green dashed curve, n = 24) of ΔdotA -GFP, and spi1b morphant zebrafish larvae injected with a LD (blue curve, n = 48) or a HD (red curve, n = 48) of WT-GFP, or with a High Dose (HD) (green curve, n = 48) of ΔdotA -GFP. Non-injected CTRL morphant fish (black dashed curve, n = 48), and spi1b morphant fish (black curves, n = 48) were used as control. Infected and control larvae were incubated at 28°C. Data plotted are from two pooled independent experiments. B) and E) Bacterial burden evaluation by quantification of % of fluorescent pixel counts on individual injected larvae followed over time by 0 to 72 hpi. Each larva was imaged daily, and images were analysed with Fiji for bacterial burden evaluation. One experiment per phagocyte type plotted, 6 larvae for each condition. D) Survival curves of CTRL morphant zebrafish larvae injected with a LD (blue dashed curve, n = 36) or a HD (red dashed curve, n = 36) of WT-GFP, or with a HD (green dashed curve, n = 24) of ΔdotA -GFP, and csf3r morphant zebrafish larvae injected with a LD (blue curve, n = 24) or a HD (red curve, n = 36) of WT-GFP, or with a HD (green curve, n = 36) of ΔdotA -GFP. Non-injected CTRL morphant fish (black dashed curve, n = 48), and csf3r morphant fish (black curve, n = 36) were used as control. Data plotted are from two pooled independent experiments. Significant differences are highlighted with stars (see experimental procedure for statistical analysis) C) and F) Representative images of L. pneumophila dissemination, determined by live imaging using a fluorescence stereomicroscope, of Tg(mfap4::mCherryF) spi1b morphant larvae (C) and of Tg(LysC::DsRed)nz50 (F) csf3r morphant larvae non infected, or infected with a LD or a HD of WT-GFP, or a HD of ΔdotA-GFP. The same infected larvae were live imaged 4h, 24h, 48h, and 72h post L. pneumophila injection. Overlay of GFP and mCherry fluorescence is shown. P < 0.05 was considered statistically significant (symbols: **** P < 0.0001; ***P < 0.001; **P < 0.01; *P < 0.05). No symbol on graphs means that not statistically differences were observed.