
Fig. 5
- ID
- ZDB-IMAGE-230518-79
- Publication
- Lv et al., 2023 - Epigenetic landscape reveals MECOM as an endothelial lineage regulator
- All Figures
- Figures for Lv et al., 2023
|
Fig. 5
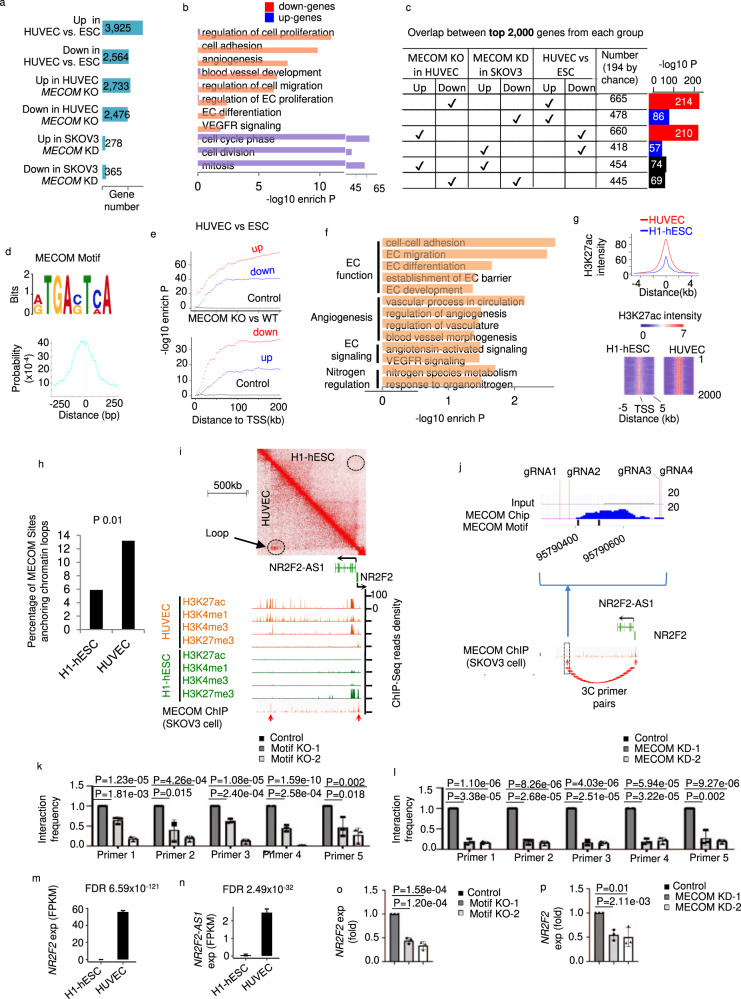
a Number of differentially regulated genes comparing pairs of conditions. b Pathways significantly enriched in differential genes between WT and MECOM KO HUVEC pool. c Pairwise comparisons among genes regulated by MECOM in HUVEC, genes regulated by MECOM in SKOV3 cell, and genes regulated in EC differentiation. d The MECOM binding motif (top) and its distribution around centers of ChIP-Seq enrichment peaks (bottom). e Enrichment of MECOM binding motif plotted against distance to genes differentially expressed in EC differentiation (top) or upon MECOM KO in EC (bottom). f Pathways enriched in genes associated with MECOM motif in promoter region from TSS to 5 kb upstream. g Average signal intensity of H3K27ac at MECOM target sites in HUVEC and H1-hESC (top) and heat map to show the signal intensity of H3K27ac at each base pair (column) of individual MECOM target site (row) (bottom). h Percentage of MECOM target sites overlap with chromatin loops in HUVEC and H1-hESC respectively. i Two-dimensional heat map of chromosomal contact frequency (top), signal density of chromatin marks and MECOM ChIP-Seq (bottom) at NR2F2/NR2F2-AS1 locus in HUVEC. Red arrows indicate enrichment peaks of ChIP-Seq signal for MECOM. j Location of inferred MECOM-to-NR2F2 binding site (in the blue box). The enlarged figure shows the location of MECOM binding signal, motif, and the four CRISPR gRNA locations. k, l Relative interaction frequency measured by 3 C assays. m, n Expression level of NR2F2 and NR2F2-AS1 in H1-hESC and HUVEC. o, p Relative gene expression levels of NR2F2. Data are presented as mean values ± SD; n = 3 (j–l and o, p) and n = 2 (m, n) biologically independent samples. P values are determined by a modified two-tailed Fisher Exact test implemented in DAVID v6.8 (b, f), two-tailed Fisher Exact test (c, e), two-tailed Poisson test (h), and two-tailed Negative Binomial test implemented in edgeR v3.14.0 (m, n), and two-tailed Student’s t test (k, l, o, p). Source data are provided as a Source Data file.