
|
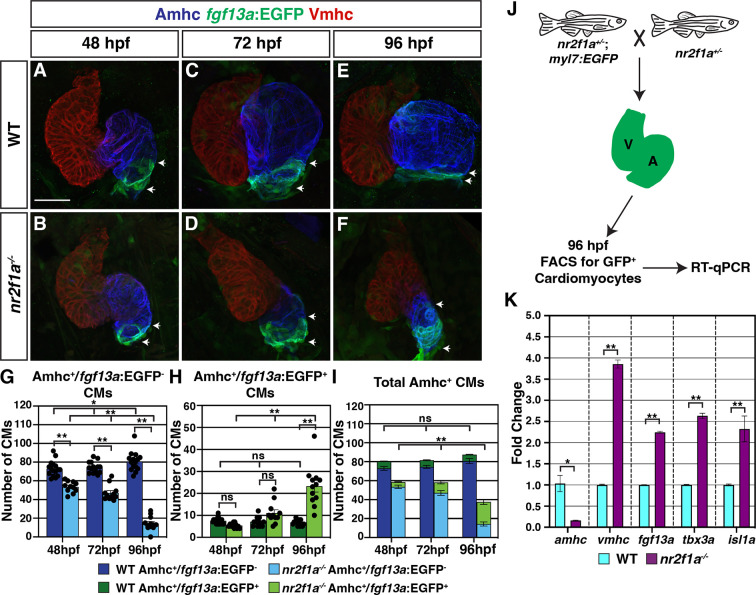
Figure 2
(A–F) IHC for Amhc (blue), Vmhc (red), and fgf13a:EGFP (green). White arrows indicate boundaries of Et(fgf13a:EGFP) expression within the atrium. Number of embryos examined - 48 hr post-fertilization (hpf): wild-type (WT) (n=10), nr2f1a-/- (n=12); 72 hpf: WT (n=10), nr2f1a-/- (n=10); 96 hpf: WT (n=7), nr2f1a-/- (n=10). (G–I) Quantification of Amhc+/fgf13a:EGFP-, Amhc+/fgf13a:EGFP+, and total Amhc+ cardiomyocytes (CMs) using the Tg(myl7:DsRed2-NLS) transgene within the hearts of WT and nr2f1a mutants. Error bars indicate s.e.m.; 48 hpf: WT (n=16), nr2f1a-/- (n=11); 72 hpf: WT (n=14), nr2f1a-/- (n=11); 96 hpf: WT (n=15), nr2f1a-/- (n=12). (J) Schematic for the isolation of cardiomyocytes at 96 hpf using the Tg(myl7:EGFP) transgene. (K) Fold change of marker genes relative to β-actin from real-time quantitative PCR (RT-qPCR) on isolated cardiomyocytes of WT and nr2f1a mutants at 96 hpf. Scale bar indicates 50 μm. Differences between WT and nr2f1a-/- were analyzed using ANOVA with multiple comparisons. *p=0.05–0.001, **p<0.001.
Pacemaker cardiomyocyte (PC) identity expands from the venous pole across the atrium in nr2f1a mutant hearts.