
Fig. 4
- ID
- ZDB-IMAGE-230516-4
- Publication
- Yu et al., 2022 - Kinesin-5 Eg5 is essential for spindle assembly, chromosome stability and organogenesis in development
- All Figures
- Figures for Yu et al., 2022
|
Fig. 4
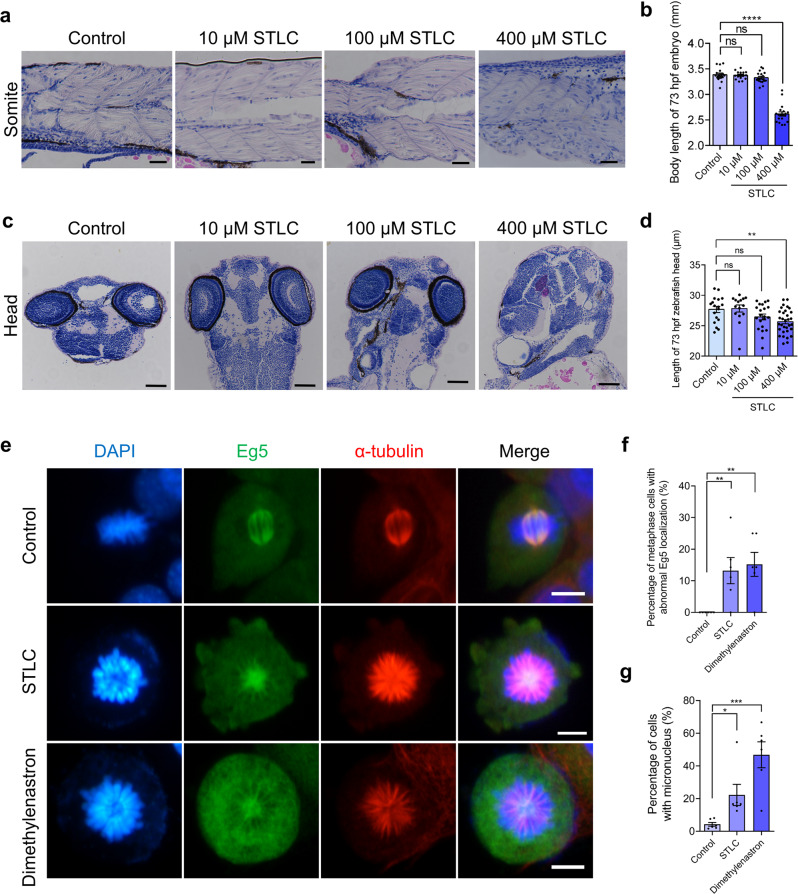
a Representative HE images of the zebrafish somites at 73 hpf in the control, 10 μM STLC, and 100 μM STLC groups. Scale bar, 50 μm. b The body length of 73 hpf zebrafish embryos in the control, 10 μM STLC, and 100 μM STLC groups. c Representative HE images of the zebrafish head at 73 hpf in the control, 10 μM STLC, and 100 μM STLC groups. Scale bar, 100 μm. d The length of 73 hpf zebrafish heads in the control, 10 μM STLC, 100 μM STLC, and 400 μM STLC groups. e Representative immunofluorescence images of Eg5 and α-tubulin. DAPI, blue; Eg5, green; α-tubulin, red. NIH/3T3 cells were incubated with STLC and Dimethylenastron for 48 h. Scale bar, 10 μm. f The percentage of metaphase cells with abnormal Eg5 localization in the Control, STLC, and Dimethylenastron groups. Control, 0.00 ± 0.00%; 1 μM STLC, 13.20 ± 4.13%; 1 μM Dimethylenastron, 15.18 ± 3.79%. Groups = 6, N = 306, 56, 40. g The percentage of cells with micronucleus in the Control, STLC, and Dimethylenastron groups. Control, 4.27 ± 1.16%; 1 μM STLC, 22.24 ± 6.50%; 1 μM Dimethylenastron, 46.76 ± 7.91%. Groups = 6, N = 306, 67, 63. For all graphs, mean ± SEM was shown. Student’s t test. ns, p > 0.05; *p < 0.05; **p < 0.01; ***p < 0.001, ****p < 0.0001.