
|
Fig. 4
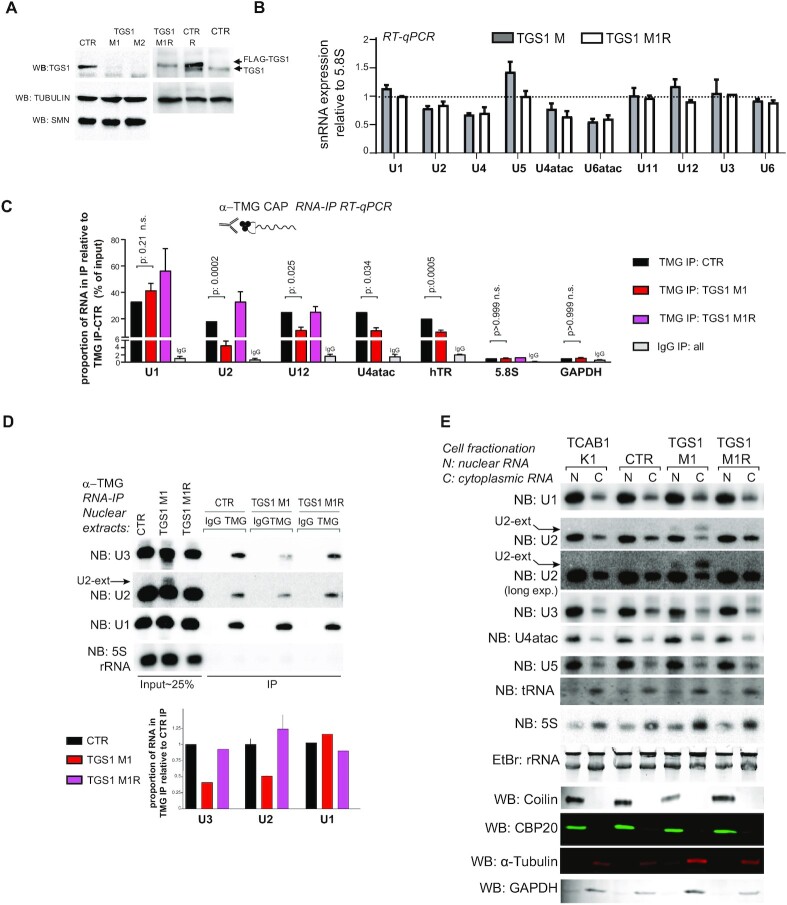
TGS1 deficiency affects maturation of U2 snRNAs in human cells. (A) Western blotting (WB) showing TGS1 expression in two independent CRISPR clones of HeLa cells (M1, M2). CTR is the parental cell line; TGS1 M1R and CTR R are a TGS1 M1 and a parental line stably expressing FLAG-TGS1. Tubulin is a loading control. The abundance of the SMN protein is not affected by mutations in TGS1 (see also Supplementary Figures S3C, D and S6B). (B) RT-qPCR showing the abundances of the indicated snRNAs in TGS1 M1, TGS1 M2 (collectively indicated as TGS1 M) and TGS1 M1R cells. Data from three independent experiments are relative to parental HeLa cells (set to 1) and normalized to 5.8S rRNA. The U3 snoRNA (U3) and the uncapped U6 and U6atac snRNAs are controls. No statistically significant differences were observed between TGS1 M and TGS1 M1R cells (error bars: ± SEM; P-values: all > 0.05; two-way ANOVA with Sidak's multiple comparisons test). (C) Total RNA from control (CTR), TGS1 M1 and TGS1 M1R cells was precipitated with the R1131 anti-TMG CAP antibody (50,76,77) (TMG IP) or control IgGs (IgG IP). Histogram bars represent the fold enrichment of the indicated transcripts in RIP eluates (relative to input), determined by RT-qPCR and normalized to TMG IP from control cells (expressed as the percentage of input). IgG IP bar: values of IgG IPs for the three cell types were pooled into a single bar. MMG-capped GAPDH mRNA and the uncapped 5.8S rRNA are negative controls. Data are from 3–5 independent experiments. P-value: two-way ANOVA with Sidak's multiple comparisons test. See also Supplementary Figure S4A and B. (D) RIP was performed with the R1131 anti-TMG antibody (TMG) or control IgG on nuclear extracts from control (CTR), TGS1 M1 and TGS1 M1R cells. Membranes were probed for U3 snoRNA, U2 and U1 snRNAs; the 5S rRNA, which lacks a TMG cap, is a negative control. Histogram bars represent the quantification of the U2, U1 and U3 RNAs, by densitometric analysis. Data are from three biological replicates. Note the presence of U2 snRNA precursors (arrow) in nuclear extracts from TGS1 M1 cells, which display reduced hypermethylation of U2 snRNA and U3 snoRNA, but not of U1 snRNA. (E) Representative northern blots showing U2 snRNA precursors (arrow) in nuclear and cytoplasmic fractions. RNA was purified from nuclear and cytoplasmic extracts from: TCAB1 K1 HeLa mutant cells [this cell line, described in (48) has reduced CBs and was used as a control]; CTR, parental HeLa cells; TGS1 M1 and TGS1 M1R cells. Membranes were probed for the U1, U2, U4atac, U5 snRNA and the U3 snoRNA. 5S rRNA and tRNA-Arg were used as loading controls. EtBr rRNA staining is a loading control. Western blots with Coilin, CBP20, alpha-tubulin and GAPDH were used as loading controls.