
|
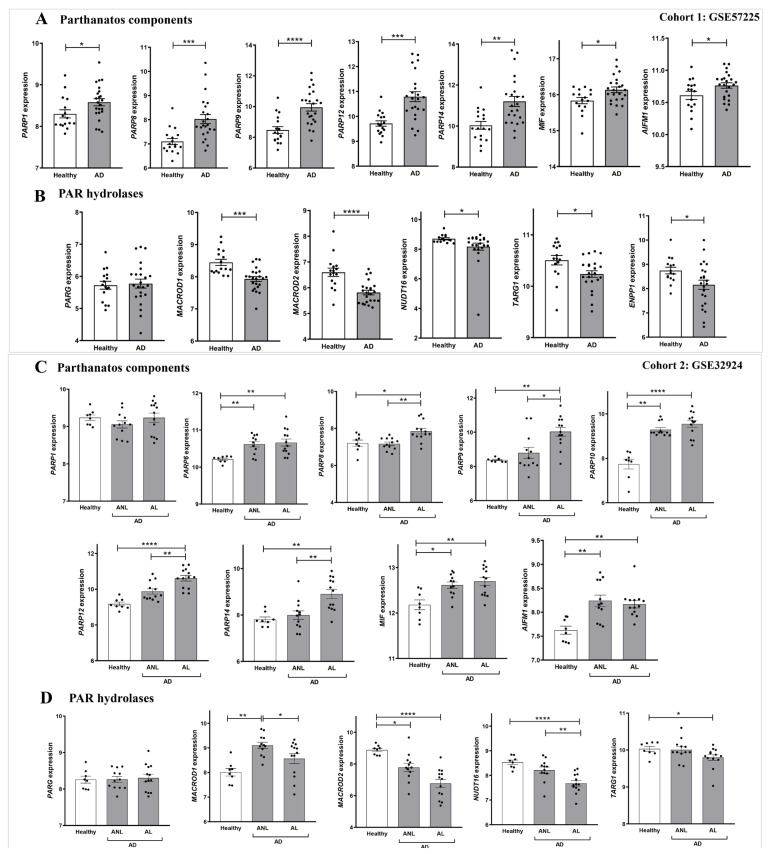
Figure 3
Differential expression profiles of genes encoding parthanatos components in AD. Transcriptomic data obtained from two different human AD cohorts, GSE57225 (A,B) and GDS4491 (C,D), from the GEO database. In cohort 1, AD was compared to healthy skin samples (A,B), and in cohort 2, skin with lesional (AL) and non-lesional (ANL) AD was compared to healthy skin samples (C,D). Each point represents one individual and the mean ± SEM for each group is also shown. p values were calculated using unpaired Student’s t-test, one-way ANOVA and Tukey’s multiple range, as appropriate. * p ≤ 0.05, ** p ≤ 0.01, *** p ≤ 0.001, **** p ≤ 0.0001.